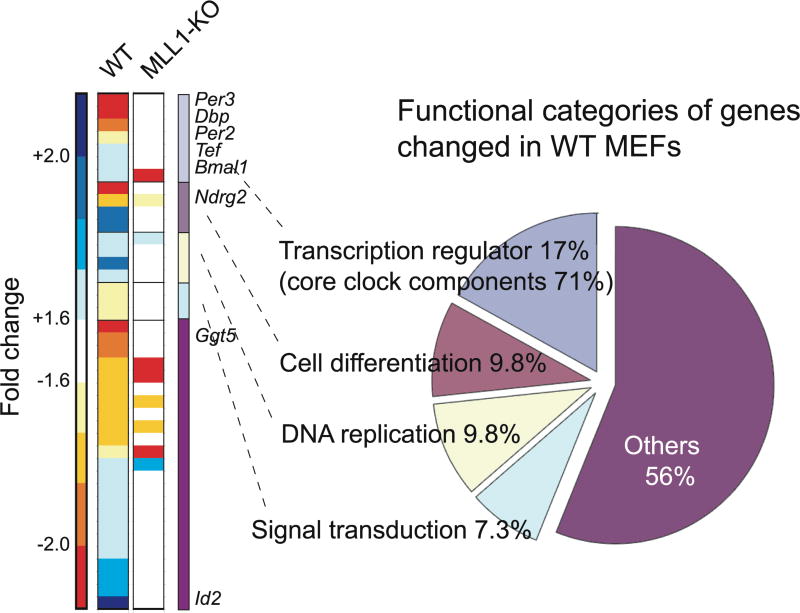
Figure 3. Global analysis of gene expression profile in MLL1-KO MEFs.
mRNA was extracted from wild type or MLL1-KO MEFs post 18hr or 30hr after serum shock, and microarray analyses were performed using GeneChip Mouse Gene 1.0 ST Array. Forty-one genes out of 35557 probes were identified as genes whose expression levels were significantly changed (>1.6 fold) between two-time point in WT MEFs. Heat map represent the fold changes of 41 genes in WT and MLL1-KO MEFs. Pie chart represent functional categories of genes changing in wild type MEFs. Eight out of 41 gene were listed as typical circadian regulated genes.

