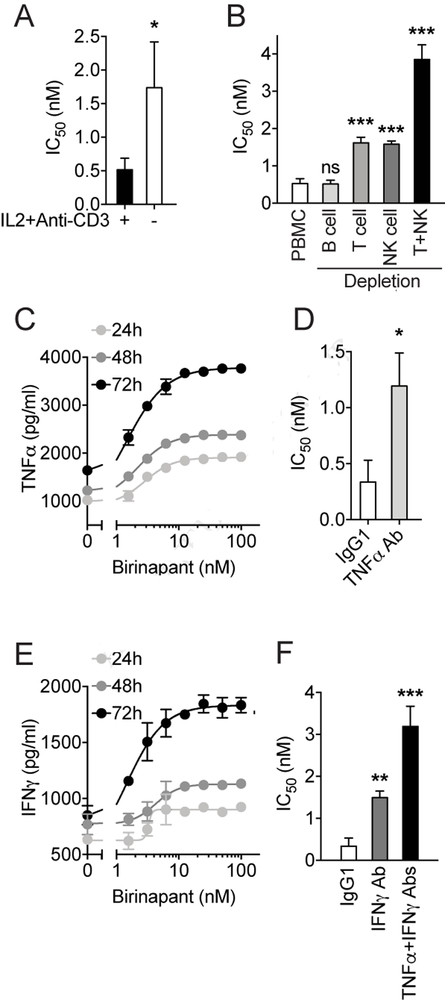
Figure 3. Identification of effective immune subtypes and cytokines involved in birinapant induced anti-tumor immunity.
(A) Bar graph showing the IC50 values calculated from birinapant dose-response inhibition curve with (+) or without (−) immune activation using IL2 and anti-CD3 antibody, and (B) with PBMC or depletion of immune subtypes as indicated. (C) Dose- and time-dependent curves of TNFα production upon birinapant stimulation. (D) Bar graph showing the IC50 values calculated from birinapant dose-response inhibition curves with TNFα neutralization using anti-TNFα antibody. (E) Dose- and time-dependent curves of IFNγ production upon birinapant stimulation. (F) Bar graph showing the IC50 values calculated from birinapant dose-response inhibition curves under conditions as indicated. The data are presented as mean ± SD from three independent experiments. *p<0.05, **p<0.01, ***p<0.001.

