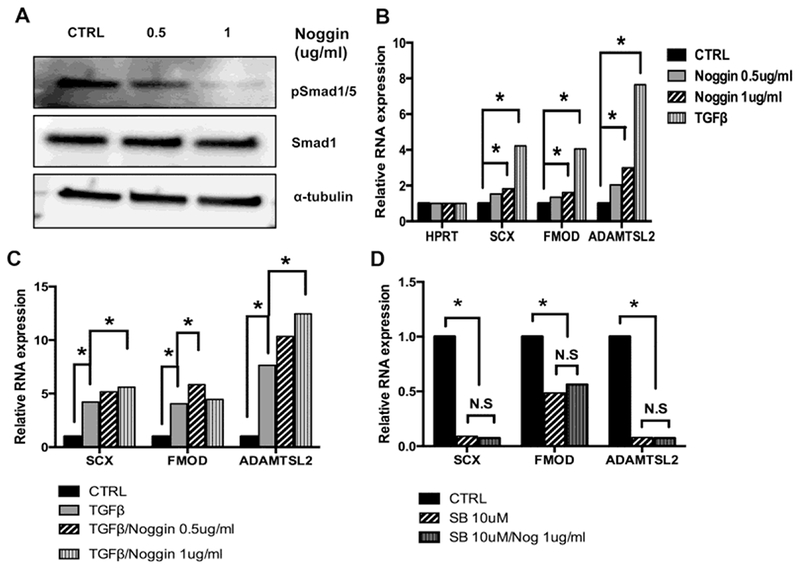
Figure 5. Noggin cooperates with TGFβ1 but is not sufficient to regulate AF differentiation.

(A) Sclerotome cultures were treated with Noggin for 48hrs. pSmad1/5 and Smad1 levels were detected by Immunoblot and α-tubulin was used as the loading control. Quantification of pSmad1/5 relative to total Smad1 is shown in Figure S4. (B) Sclerotome cultures were treated with vehicle (Ctrl), Noggin or TGFβ1 for 48 hrs. Relative expression of Scx, Fmod, and Adamtsl2 was determined by qPCR and normalized to HPRT. (C) Sclerotome cultures were treated with vehicle (Ctrl), TGFβ1, or Noggin and TGFβ1 together for 48 hrs. Relative expression of Scx, Fmod, and Adamtsl2 was determined by qPCR and normalized to HPRT. (D) Cells were treated for 48 hrs with vehicle (Ctrl), SB154382 (SB), or SB and Noggin together. Relative expression of Scx, Fmod, and Adamtsl2 mRNA was determined by qPCR and normalized to HPRT. All qPCR data was analyzed using REST software. (N.S) denotes non-significant, (*) indicates p, 0.05, (n=3 biological replicates for each condition). Full qPCR results are shown in Tables S5A–C.
