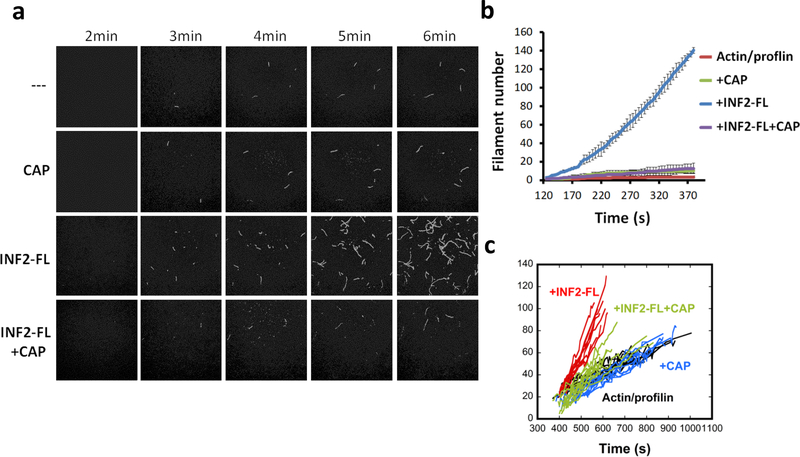
Figure 4. CAP inhibits INF2 mediated nucleation observed by TIRF microscopy.
Time-lapse TIRF microscopy images showing actin polymerization (1μM actin monomer, 10% TAMRA-actin) containing 3μM profilin in the presence or absence of 1nM INF2-FL and 50nM CAP2 exchanged with CSKA. (b) Quantification of filament number over time for TIRF assays. Three microscope fields analyzed for INF2 FL, and five fields for other conditions. Centre value represents mean and error bars are standard error of the mean. (c) Measurement of filament length over time for TIRF assays. 10 filaments for each condition.

