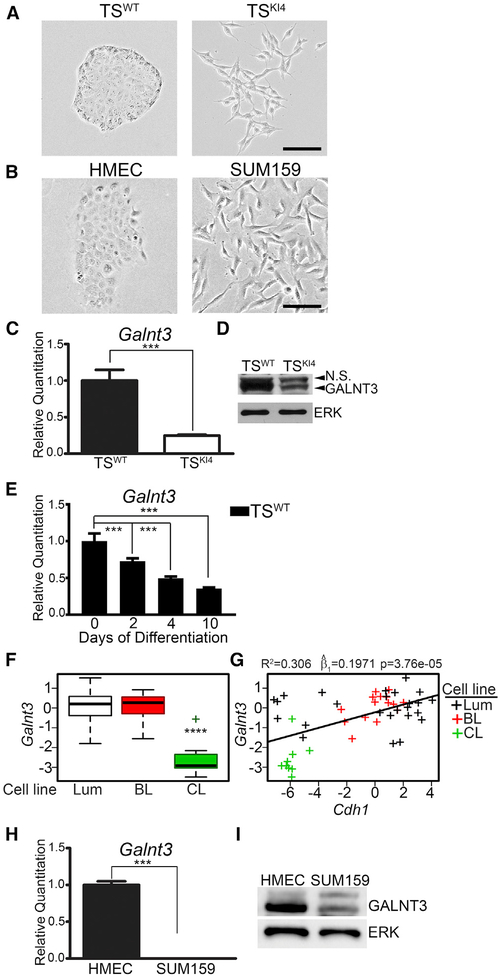
Figure 1. Loss of GALNT3 Correlates with the Gain of a Mesen chymal State.
(A and B) Phase microscopy images of TS cells (A) and HMEC and SUM159 cells (B) are representative of three independent experiments. Black bar represents 100 μm.
(C) Reduced Galnt3 transcripts in mesenchymal TSKI4 cells relative to TSWT cells. qPCR data normalized to Actb are expressed as a fold-change relative to TSWT cells and are the mean ± range of two independent experiments.
(D) Western blots are representative of three independent experiments. N.S., Non-Specific.
(E) Decreased Galnt3 transcripts with differentiation of TSWT cells by FGF4 withdrawal for the indicated number of days. qPCR data normalized to Actb are expressed as a fold-change relative to undifferentiated TSWT cells (0 day) and are the mean ± range of two independent experiments.
(F) Galnt3 expression is significantly reduced in claudin-low (CL) breast cancer cell lines. Luminal (Lum), basal-like (BL), and CL breast cancer subtypes. p value was calculated using Student’s t test and Bonferroni’s correction for multiple comparisons. ****p < 0.0001.
(G) Loss of Galnt3 is significantly correlated with reduced Cdh1 levels. Plot shows the correlation between Galnt3 and Cdh1 transcripts in breast cancer subtypes. Each “+” represents a specific breast cancer line. p value was calculated using linear regression and, represents the estimate of the slope of linear regression line.
(H) Galnt3 transcripts are reduced in mesenchymal SUM159 cells relative to HMECs. qPCR data normalized to Gapdh are expressed as a fold-change relative to HMECs and are the mean ± SEM of three independent experiments.
(I) Western blots are representative of three independent experiments.
***p < 0.001; Student’s t test.

