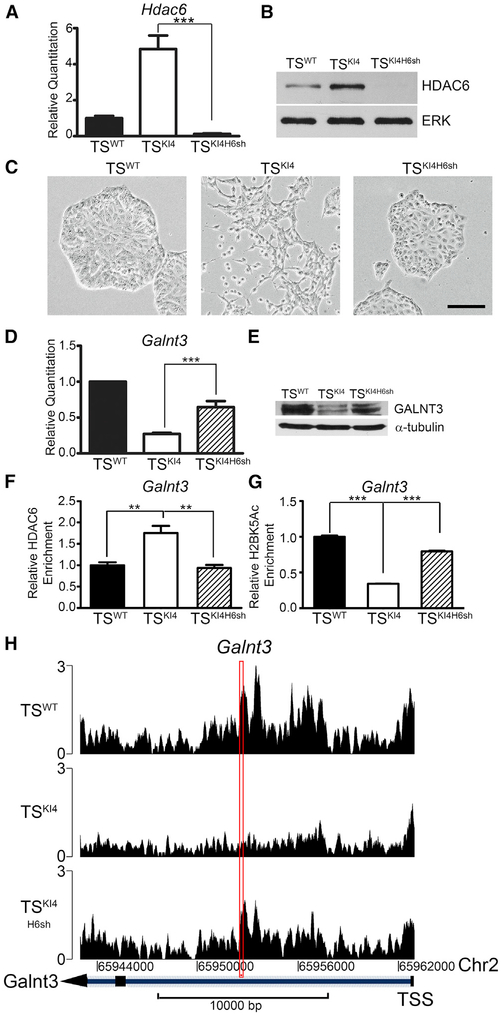
Figure 2. Galnt3 Expression Is Co-regulated by MAP3K4 and HDAC6.
(A) Hdac6 transcripts analyzed by qPCR in TSWT cells and TSKI4 cells expressing control shRNA or TSKI4 cells expressing Hdac6 shRNA (TSKI4H6sh) are shown. qPCR data normalized to Actb are expressed as a fold-change relative to TSWT cells and are the mean ± SEM of three independent experiments.
(B) Western blots of whole-cell lysates are representative of three independent experiments.
(C) Knockdown of HDAC6 in TSKI4 cells restores an epithelial morphology. Phase microscopy images are representative of three independent experiments. Black bar represents 100 μm.
(D) Hdac6 knockdown increases Galnt3 transcripts in TSKI4H6sh cells relative to TSKI4 cells. qPCR data normalized to Actb are expressed as a fold-change relative to TSWT cells and are the mean ± SEM of five independent experiments.
(E) GALNT3 protein expression increases with knockdown of HDAC6 in TSKI4H6sh cells. Western blots are representative of two independent experiments.
(F) Anti-HDAC6 ChIP-PCR shows increased HDAC6 enrichment on the Galnt3 promoter in TSKI4 cells relative to TSWT cells. Data shown are the mean ± SEM of four independent experiments.
(G) Decreased H2BK5 acetylation on the Galnt3 promoter in TSKI4 cells relative to TSWT cells, as measured by anti-H2BK5Ac ChIP-PCR. Data shown are the mean ± SEM of six independent experiments.
(H) Knockdown of HDAC6 increases H2BK5 acetylation on the Galnt3 promoter in TSKI4H6sh cells relative to TSKI4 cells. H2BK5Ac ChIP-seq read density plots at the Galnt3 transcription start site + 20 kb are shown.
Red rectangle indicates the region amplified in ChIP PCR reactions in (F) and (G). Data are expressed as the normalized read count of the immunoprecipitate (IP) divided by the normalized read count of the TSWT cell input. **p < 0.01; ***p < 0.001; Student’s t test.
See also Figure S1.

