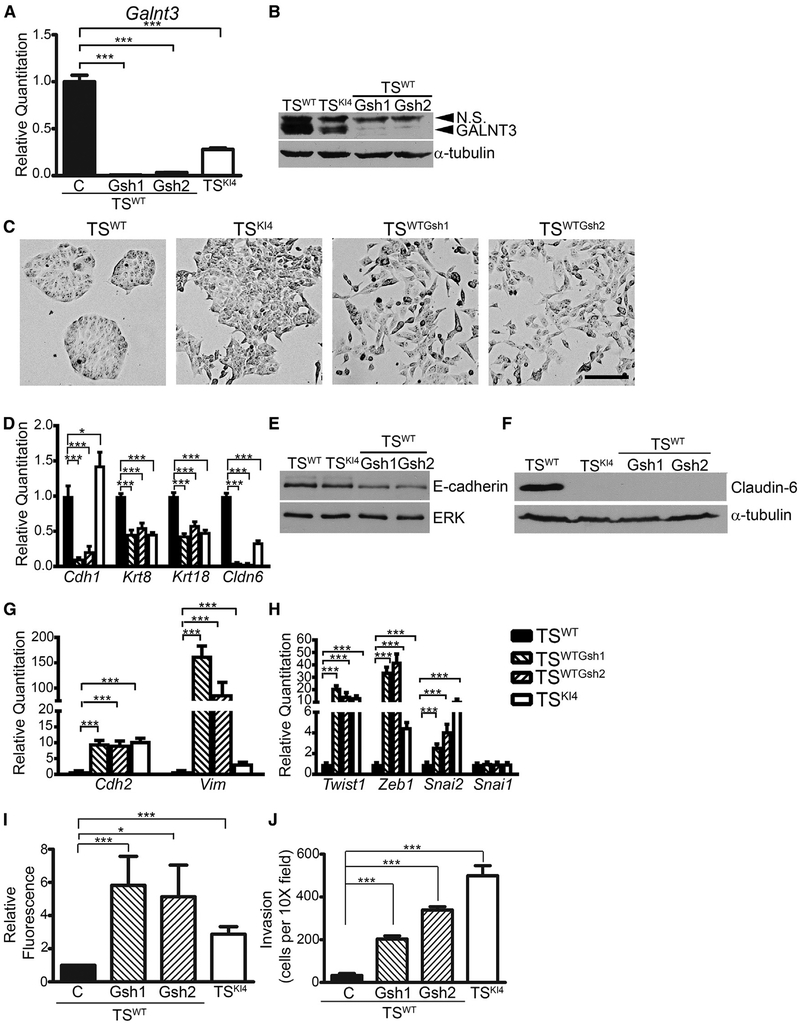
Figure 3. Knockown of GALNT3 in TSWT Cells Induces EMT.
(A) Transcripts were measured using qPCR in TSWT and TSKI4 cells expressing control shRNA (C) or TSWT cells expressing two independent Galnt3 shRNAs (TSWTGsh1 and TSWTGsh2).
(B) Western blots of whole-cell lysates are representative of three independent experiments. N.S., Non-Specific.
(C) GALNT3 knockdown in TSWT cells induces a mesenchymal morphology. Representative phase microscopy images from three independent experiments are shown. Black bar represents 100 μm.
(D) GALNT3 knockdown in TSWT cells reduces epithelial marker expression in TSWTGsh1 and TSWTGsh2 cells.
(E and F) Western blots of E-cadherin (E) and Claudin-6 (F) are representative of three independent experiments.
(G and H) Increased transcripts of mesenchymal markers (G) and EMT-inducing transcription factors (H) with reduced Galnt3 expression are shown.
(I) Impaired barrier formation in TSWTGsh1 and TSWTGsh2 cells with reduced GALNT3 expression. Diffusion of fluorescent dye across a confluent monolayer of cells is expressed as a fold-change in fluorescence relative to TSWT cells. Data shown are the mean ± SEM of three independent experiments.
(J) Loss of GALNT3 increases invasiveness in TSWTGsh1 and TSWTGsh2 cells through growth-factor-reduced Matrigel-coated transwells. Data show cells per 103 field and are the mean ± range of two independent experiments performed in triplicate.
(A, D, G, and H) qPCR data normalized to Actb are expressed as a fold-change relative to TSWT cells and are the mean ± SEM of three independent experiments. *p < 0.05; ***p < 0.001; Student’s t test.
See also Figure S2.

