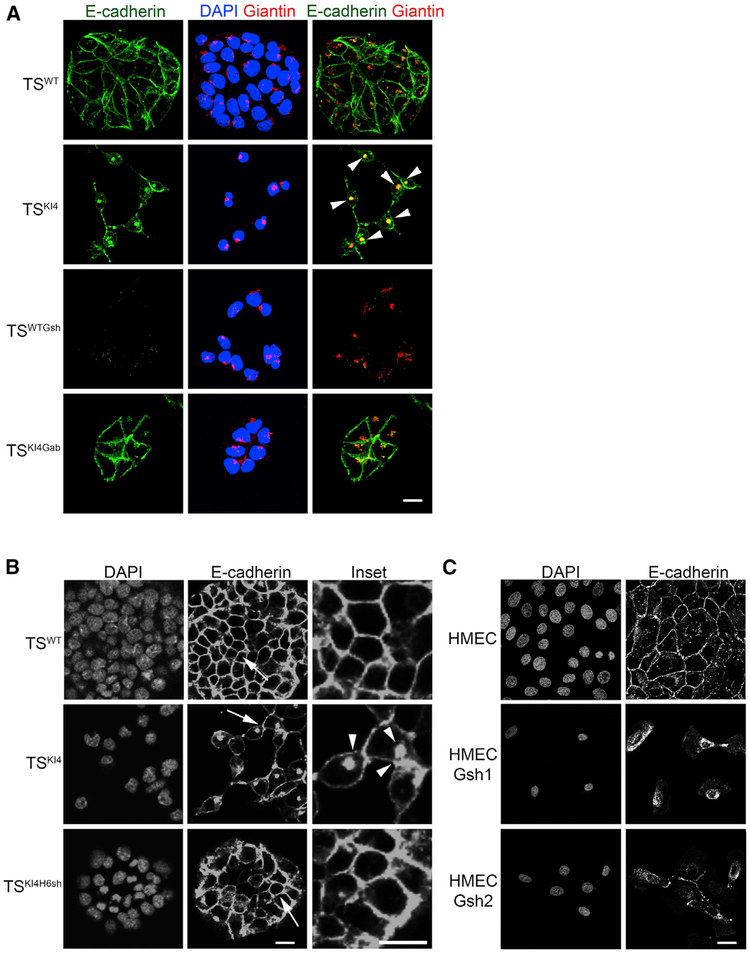
Figure 5. Loss of GALNT3 Results in the Intracellular Retention of E-Cadherin in the Golgi.
(A) Reduced GALNT3 expression in TSKI4 cells results in the retention of E-cadherin in the Golgi. Confocal images in TSWT and TSKI4 cells infected with a control virus, TSWT cells infected with Galnt3 shRNA (TSWTGsh) and TSKI4 cells expressing human GALNT3 (TSKI4Gab) are shown. 4′,6-Dia midino-2-phenylindole (DAPI; blue), E-cadherin (green), and Giantin (Golgi) (red). Arrowheads indicate co-localization of E-cadherin and Giantin in the Golgi.
(B) HDAC6 knockdown in TSKI4 cells results in the partial restoration of E-cadherin to the cell surface. Confocal images in TSWT cells and TSKI4 cells expressing control shRNA or TSKI4 cells expressing Hdac6 shRNA (TSKI4H6sh) are shown. Arrows show the area of enlarged insets. Arrowheads indicate punctate intracellular E-cadherin localization.
(C) GALNT3 knockdown in HMECs results in the intracellular trapping of E-cadherin. Confocal images for HMECs infected with a control shRNA or two independent Galnt3 shRNAs (HMECGsh1 and HMECGsh2) are shown.
(A–C) Images are representative of three independent experiments. White bar represents 50 μm.

