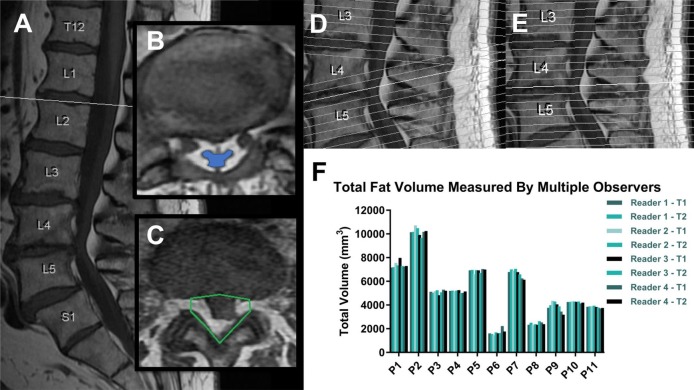
Figure 1.
Differences in spinal T1 imaging with epidural fat region of interest selection and validation. (A) Sagittal T1-weighted image slices were used to determine the boundaries of the lumbar spine from mid-L1 to mid-S1. (B, C) Axial image slices were used to locate the thecal sac and the surrounding epidural fat to draw our eight-point region of interest on each slice. In patients with epidural lipomatosis, the condition is diagnosed by observing the epidural fat’s deformation of the thecal sac which is highlighted in blue on image B. This portion of the thecal sac is severely compressed. (D, E) Two different MRI techniques were used: one following the conventional clinical protocol with a slanted correction at mid-L4 (D) and one without (E). (F) Graph showing interobserver and intraobserver variability for total fat volume calculations among four different readers with two trials each.

