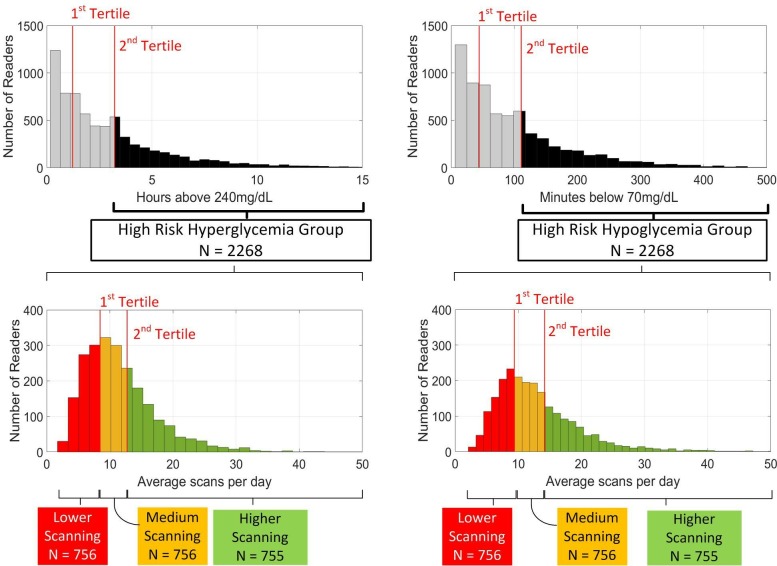
Figure 1.
Stratification of the data into high-risk groups for hypoglycemia and hyperglycemia. Top panels show the distribution of initial time spent in hyperglycemia (left) and hypoglycemia (right). Individuals whose initial glycemic measures were to the right of the second tertile were designated to be in the high-risk group. The high-risk groups were further stratified based on average scanning frequency over 6 months as shown in the bottom panels.

