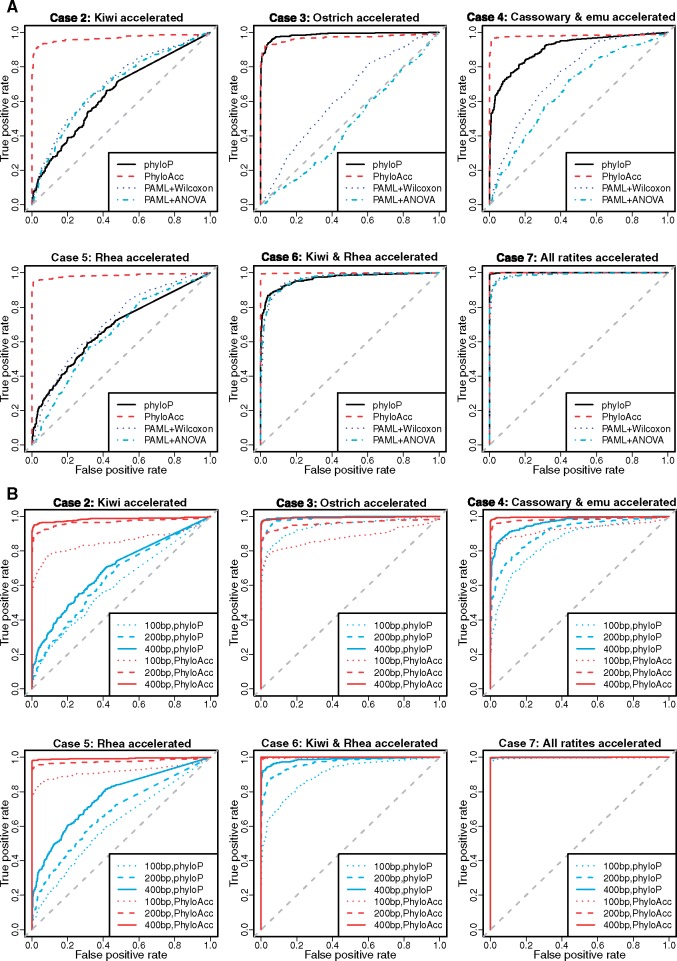
Fig. 2.
Simulated results on the avian topology. (A) ROC curves for PhyloAcc, phyloP and PAML+Wilcoxon, PAML+phylANOVA in different ratite acceleration cases. (B) ROC curves for PhyloAcc and phyloP in different ratite acceleration cases and different lengths of elements. We treated elements with each acceleration pattern (cases 2–7 separately) as positive and all conserved elements (case 1) as negative, and compared sensitivity and specificity of PhyloAcc to others.

