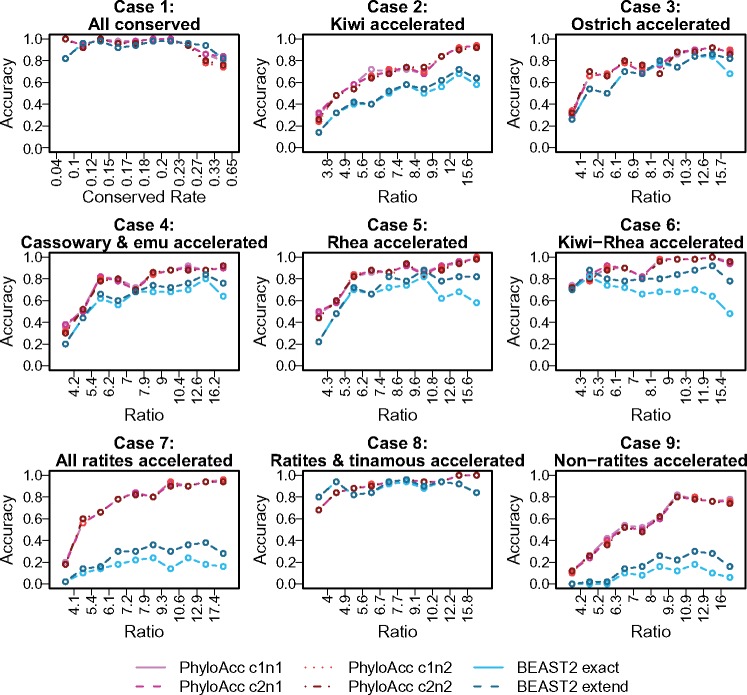
Fig. 3.
Comparison of accuracy recovering substitution rate shift patterns between BEAST2 and PhyloAcc in each simulation case. In each case, we ordered and categorized the simulated elements into ten equal-sized groups according to the ratio between substation rates of accelerated and conserved states (the quantiles of in each group are shown in supplementary fig. S8A, Supplementary Material online). X axis shows the boundary of the ratio in each group; red curves are the accuracy of PhyloAcc (using different priors on substitution rates) and blue curves are of BEAST2. c1 and c2 are Gamma(5, 0.04) and Gamma(1, 0.2), respectively, narrow and wide prior for conserved rate; n1 and n2 are Gamma(10, 0.2) and Gamma(4, 0.5), respectively, narrow and wide prior for accelerated rate. “cXnX” means a combination of them. “BEAST2 exact” shows the accuracy recovering the true pattern, whereas “BEAST2 extend” shows the accuracy allowing “loss-regain” pattern (see main text).

