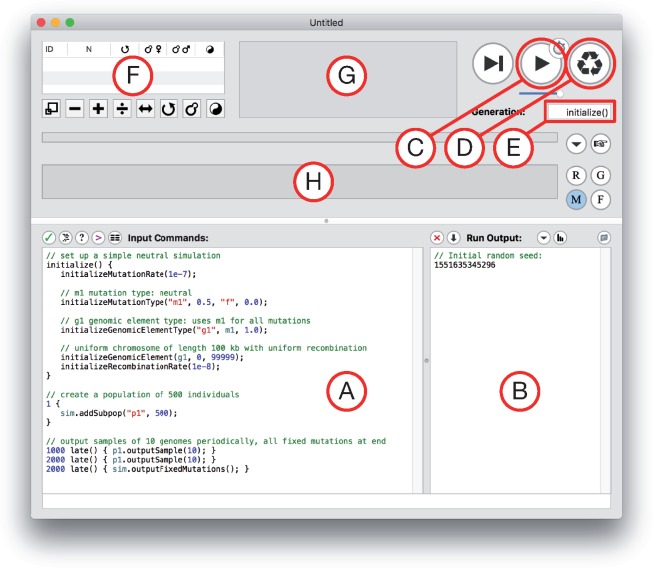
Fig. 1.
A snapshot of a new modeling window in SLiMgui, with major components labeled by letters. (A) The scripting pane, which contains the script that SLiM will run. (B) The output pane, where text output from the running model appears. (C) The play button, which starts execution of the model in SLiMgui. (D) The recycle button, which resets SLiMgui to use the current model script. (E) The generation counter, which shows the current generation in the simulation. (F) The population view, which lists the subpopulations in the population and shows some of their properties. (G) The individual view, which shows the simulated individuals and their fitness values (indicated by color). (H) The chromosome view, which shows the simulated chromosome across the population, including the frequencies of all mutations.

