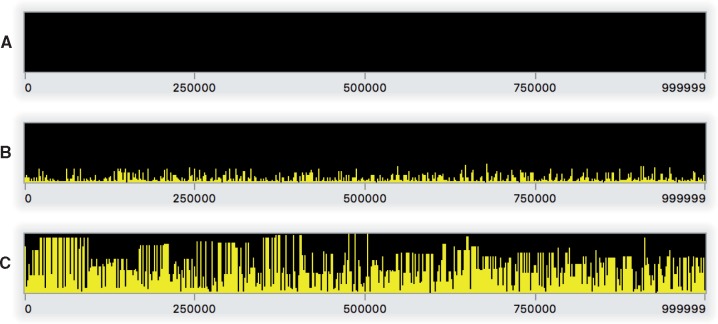
Fig. 2.
Snapshots of Step 1’s model running in SLiMgui at the end of generation 1 (A), 500 (B), and 10000 (C). These snapshots of the chromosome view for this neutral model show (A) the empty initial chromosome, (B) the initial establishment of neutral diversity early in the model run, and (C) an equilibrium level of neutral diversity after 10N generations. Each panel shows the simulated chromosome from beginning to end (left to right); each bar represents one mutation, colored yellow (online only) because it is neutral, with a height corresponding to its frequency in the population. Fixed mutations, of which there would be many in panel C, are not shown since by default they are removed from the simulation by SLiM (see text).

