
Figure 10.
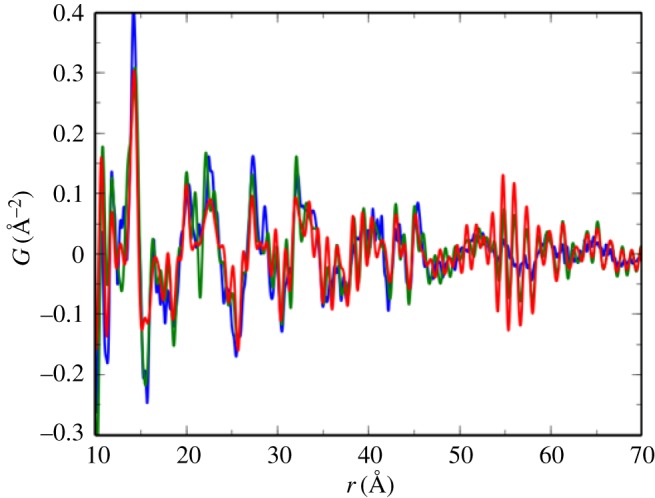
PDFs from a nanosized pharmaceutical drug in an aqueous suspension at different concentrations. The blue (black in print) curve is 5 wt%, the green (darker grey in print) curve is 0.6 wt% and the red (light grey in print) curve is 0.25 wt%, which is the actual dose loading. Adapted from [45]. (Online version in colour.)