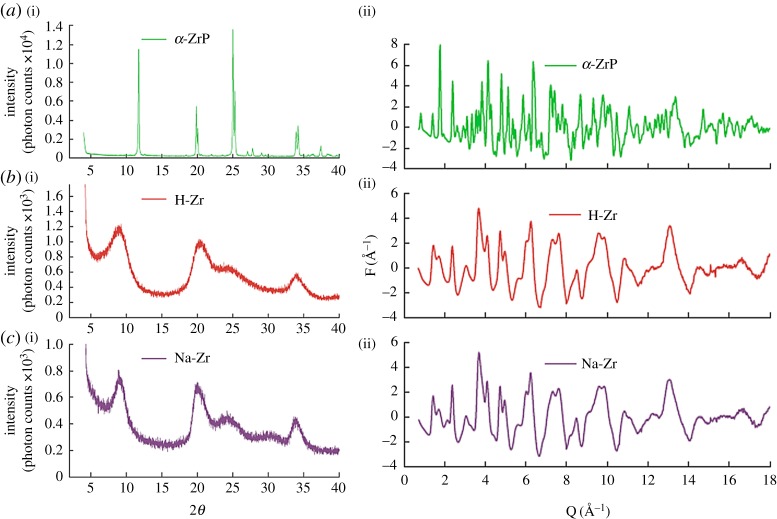
Figure 4.
From conventional powder diffraction to the PDF. The patterns on the ((a)(i),(b)(i),(c)(i)) are conventional powder diffraction patterns from three samples, a crystalline material (a), and two nanocrystalline samples (b) and (c). ((a)(ii),(b)(ii),(c)(ii)) The diffraction patterns from the same samples when it is measured and analysed to get the total scattering data suitable for PDF analysis. There is considerably more information in the patterns in the right column. The data in (a) and (b) are shown in figure 1. Adapted from [8]. (Online version in colour.)

