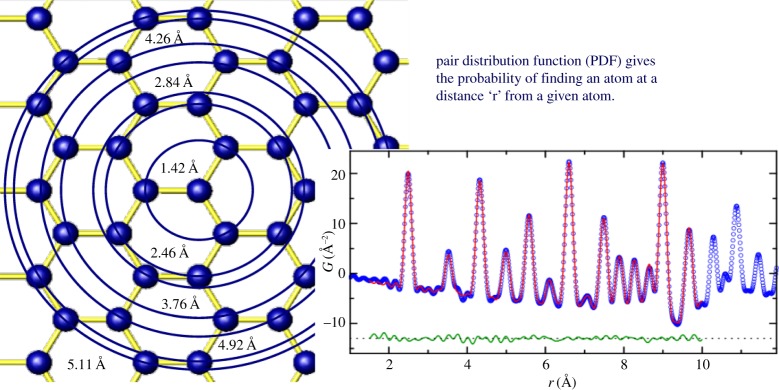
Figure 5.
A schematic of the modelling process. Each unique atom is placed at the origin and larger and larger circles are drawn. Whenever a new atom intersects with the circle, a unit of intensity is added to a histogram at the position r that is the radius of the circle at the intersection point. Thermal motion of materials causes the histogram to broaden into a Gaussians, and so the PDF is well represented by a sum of independent Gaussian functions. Lower right: the blue open symbols are the measured PDF from nickel powder and the red solid line is the PDF calculated from the structure of nickel. The green curve, offset below shows the difference, which in this case is dominated by noise in the measurement. (Online version in colour.)

