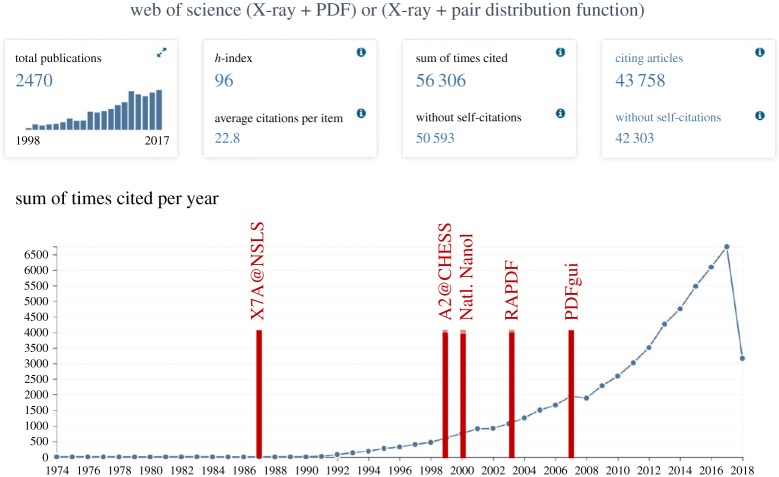
Figure 6.
A screenshot from a search from ISI web of science for (X-ray AND PDF) OR (X-ray AND pair distribution function), showing the growth in number of papers referencing the technique. The thick red vertical lines indicate methodological developments, and other external factors, which in the author's view have significantly contributed to the growth of the method. The list of factors is not intended to be exhaustive, but rather illustrational. The factors are discussed in the text. (Online version in colour.)

