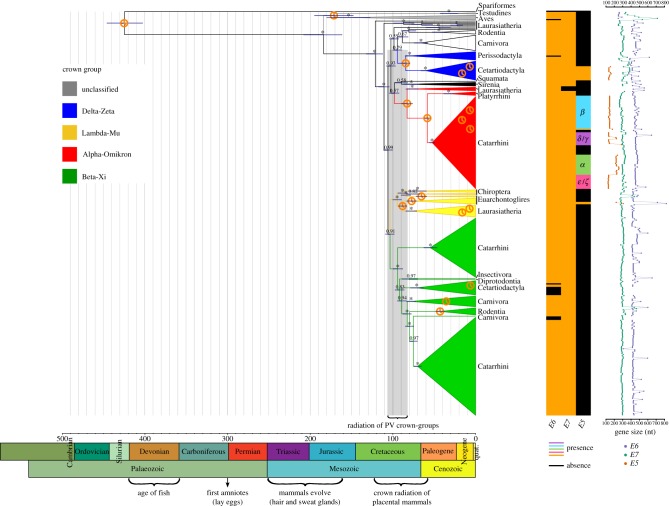
Figure 1.
Dated Bayesian phylogenetic tree for a dataset containing 343 PVs. The tree was constructed at the nucleotide level based on the concatenated E1-E2-L2-L1 genes. The scale bar is given in million years ago (Ma). Values at the nodes correspond to posterior probabilities, where asterisks indicate full support. Error bars encompass 95% highest posterior density for the age of the nodes. Clock symbols indicate the nodes used for calibration. Clades are coloured according to the PV crown group classification, as indicated in the legend on the left. Next to the tree on the right, the taxonomic group (superorder, class, order, parvorder, no rank) corresponds to the one in which the host clades could best be summarized. Below the tree, a geological time scale is drawn. The matrix next to the taxonomic host groups indicates the presence/absence of the E6, E7 and E5 genes for each PV (see legend), and the classification of E5 (α, β, γ, δ, ε, ζ) is indicated within the matrix. Next to the matrix, the size of the oncogenes is plotted. (Online version in colour.)

