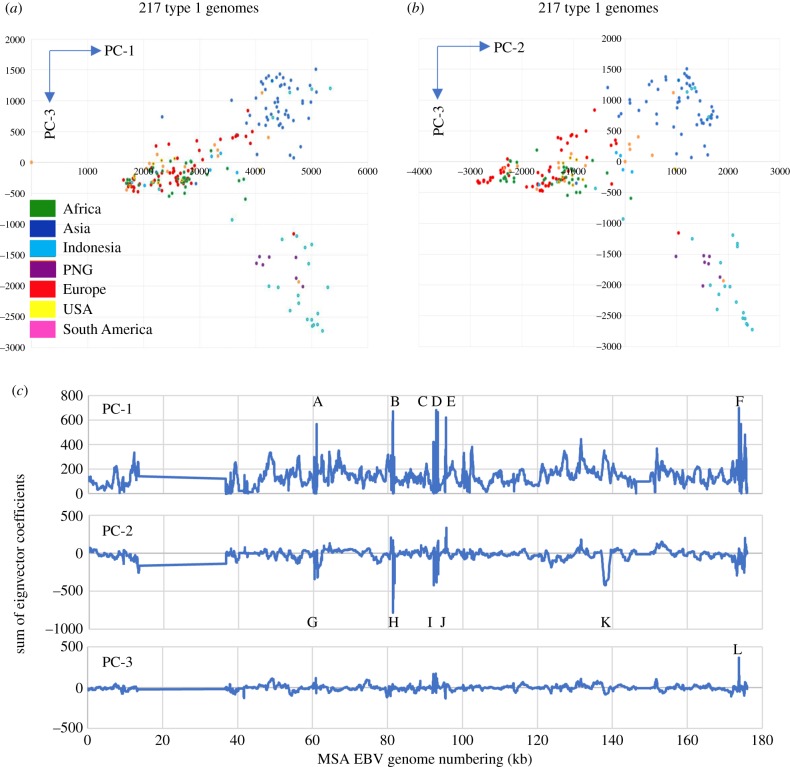
Figure 1.
Principal component analysis of type 1 EBV sequence diversity coloured by geographical origin (colours as shown in part a) using 217 type 1 EBV strains (a) PC-1 versus PC-3, (b) PC-2 versus PC-3. PC-1 versus PC-2 with the same dataset is shown in fig. 1B of [6]. (c) Eigenvector coefficients plotted with a smoothing window of 20 nt along the MSA genome (plotted as sum of coefficients on the ordinate axis). Labelled peaks are listed in electronic supplementary material, figure S2. PNG, Papua New Guinea.

