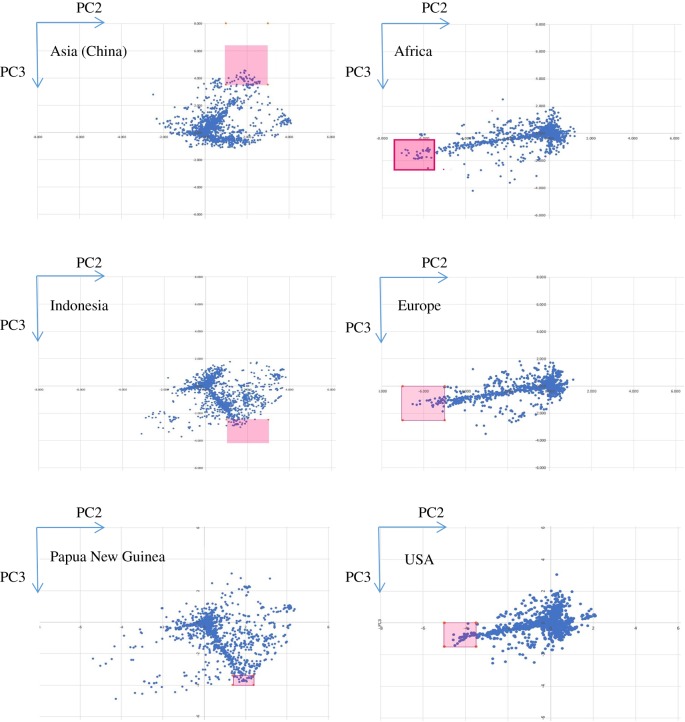
Figure 3.
PCA nucleotide contribution plots of geographical groups identify three major patterns consistent with three major clades in the phylogenetic tree of type 1 sequences. Nucleotide positions from the marked areas, which were chosen to characterize differences between the geographical groups, are listed in electronic supplementary material, table S3.

