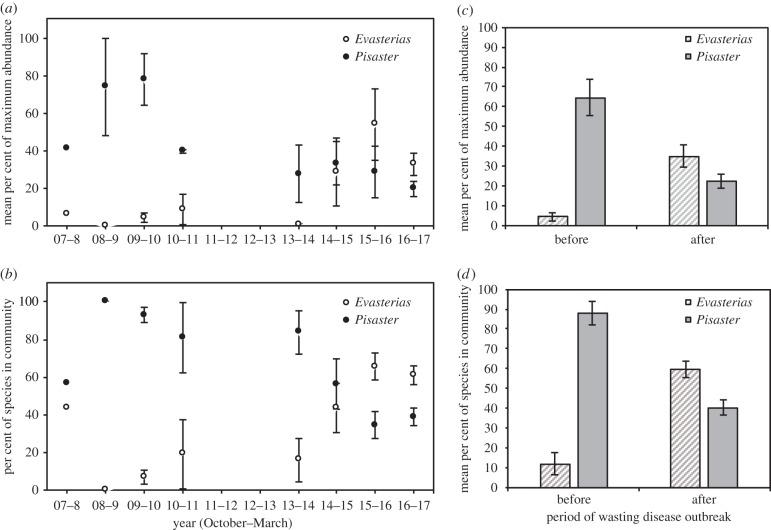
Figure 1.
Long-term Evasterias and Pisaster population data. (a) Mean percentage of maximum abundance for each species and (b) mean percentage of each species within the sea star community, during winter surveys from 2008 to 2017. We binned winter seasons by October–March. Sample size varies across years where n = 1 survey for 2007–2008, n = 2 surveys for the years for 2008–2009 and 2010–2011, n = 4 for 2009–2010 and 2013–2014, n = 5 surveys for 2014–2015 and 2015–2016, and n = 30 surveys for 2016–2017. (c) Mean percentage of maximum abundance for each species and (d) mean percentage of each species within the sea star community, before and after estimated time of outbreak of wasting disease, n = 9 surveys for years before wasting and n = 40 surveys for years after wasting. Note that the single site surveyed in 2007–2008 was naturally high in Evasterias relative to other sites. Error bars represent ±1 s.e.

