Figure 3.

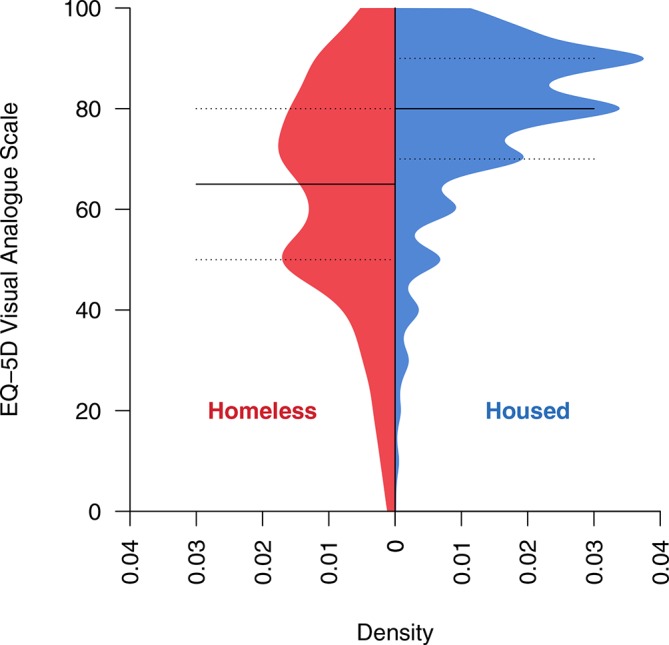
Histograms of EQ-5D-Visual Analogue Scale score, by homeless/housed status. Horizontal lines show median and 25% and 75% quantiles.

Histograms of EQ-5D-Visual Analogue Scale score, by homeless/housed status. Horizontal lines show median and 25% and 75% quantiles.