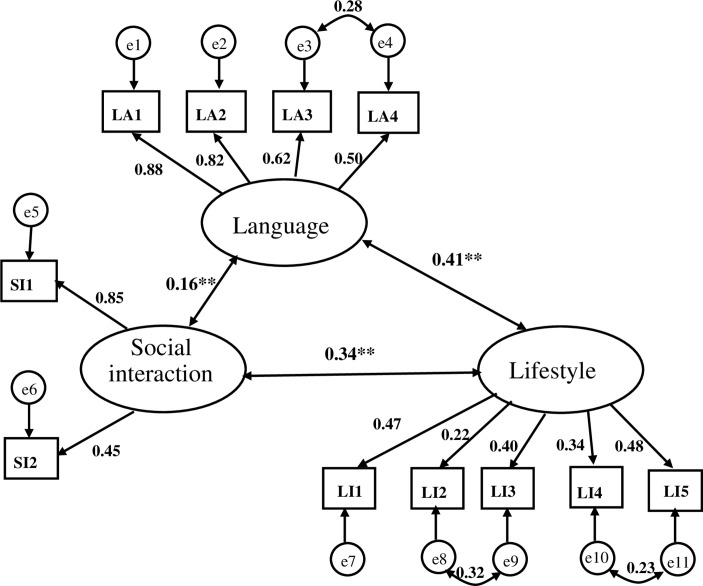
Figure 3.
The confirmatory factor analysis model of acculturation. Standardised path coefficients were reported. The data-model fit indices are p=0.129>0.05, CMIN/df=1.26, GFI=0.992, CFI=0.996, RMSEA=0.015. **p<0.001. CFI, confirmatory fit index; GFI, goodness of fit index; LA1–LA4, the four items measuring respondents’ language; LI1 – LI5, the five items measuring respondents’ lifestyle; RMSEA, root mean square error of approximation; SI1–SI2, the two items measuring respondents’ social interaction.

