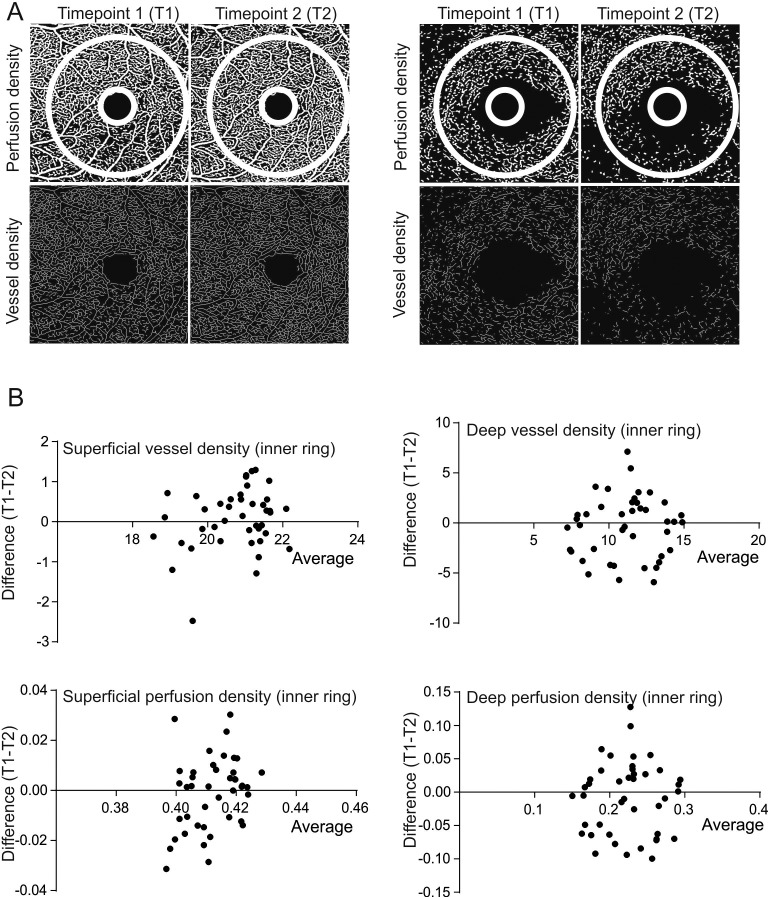
Figure 2.
Analysis of repeatability of vessel and perfusion density for the central 3 × 3 mm scan. (A) Representative images showing perfusion and vessel density analysis images for the superficial and deep retinal layers at two consecutive time points (T1 and T2). The white circle represents the area analyzed by the inbuilt OCTA device algorithm. (B) Bland-Altman plots show the level of agreement for the vessel density and perfusion density for the superficial and deep retinal layers.

