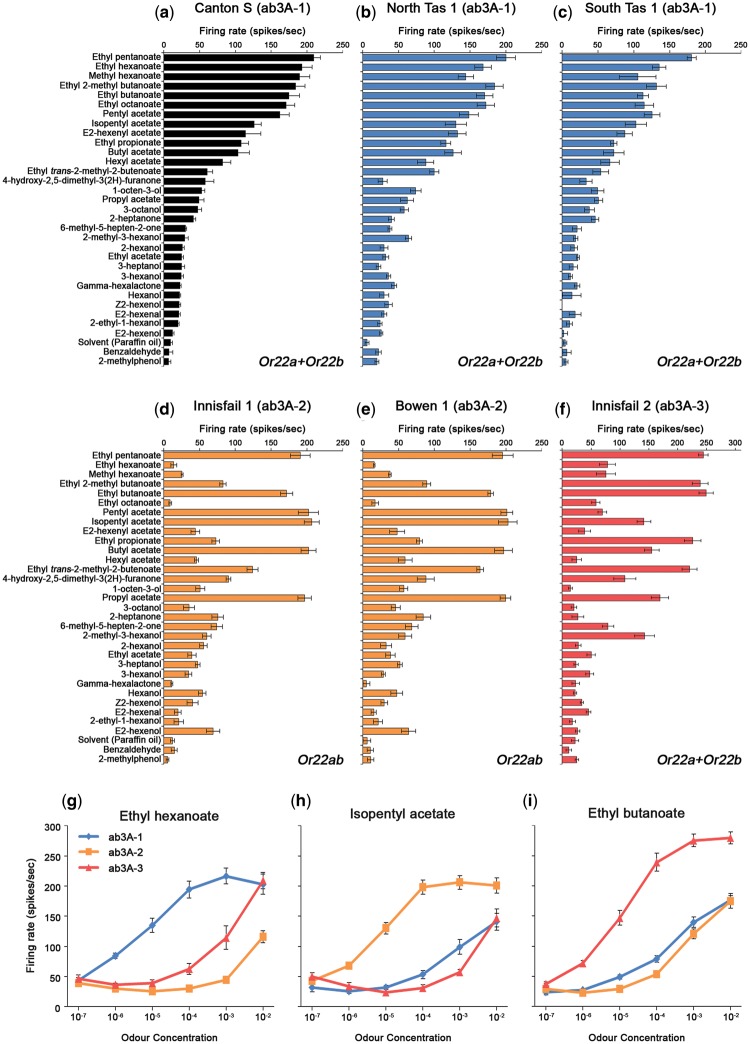
Fig. 1.
Identification of three ab3A neuronal response phenotypes in natural populations of Drosophila melanogaster. (a) The ab3A response profile of Canton-S; named the ab3A-1 phenotype. (b, c) Two isogenic lines derived from populations from southern Australia (from North and South Tasmania, respectively) show the ab3A-1 phenotype (comparing a and b, Spearman rank correlation, P < 0.001; comparing a and c, P < 0.001). (d, e) Two isogenic lines from northern populations (from Innisfail and Bowen, respectively) exhibit a different ab3A phenotype (comparing a and d, P = 0.380; comparing d and e, P < 0.001); we call this the ab3A-2 phenotype. (f) A second isogenic line derived from the Innisfail population shows an ab3A phenotype distinct from ab3A-1 and -2 (compare a and f, P = 0.096; compare d and f, P = 0.055); named the ab3A-3 phenotype. (g–i) Neuronal dose–response curves for the three ab3A phenotypes to ethyl hexanoate (g), isopentyl acetate (h), and ethyl butanoate (i) showing shifts in major ligand sensitivity. For ease of identification, blue represents the ab3A-1 phenotype, orange the ab3A-2 phenotype, and red the ab3A-3 phenotype. Paraffin oil is the solvent-only control. Data are represented as the mean ± SEM, n = 6 for all except c and e (n =3). For a–f, all odorants were tested at 10−2 except for ethyl and methyl hexanoate (tested at 10−4) due to the known high sensitivity of the ab3A neuron to these odorants (Hallem and Carlson 2006).

