
Figure 2.
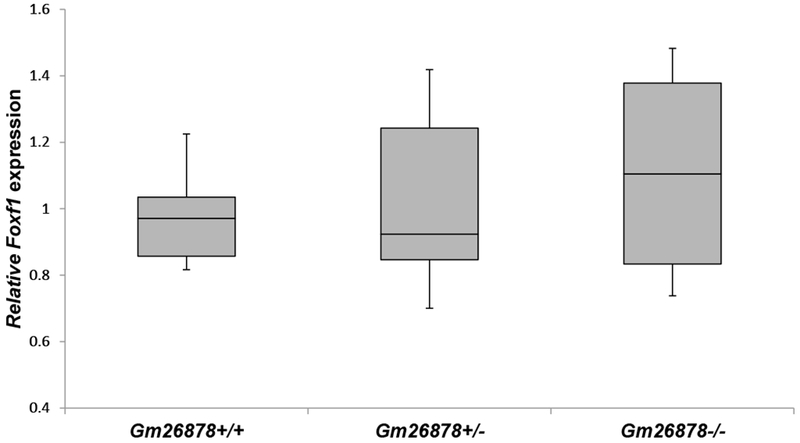
Comparative RT qPCR analysis of the Foxf1 mRNA levels in lung tissues of the P18.5 G2 Gm26878+/+, Gm26878+/−, and Gm26878−/− mice. Means of three technical replicas for each biological replica are ploted (ANOVA test comparing Gm26878−/− mice lung with wild-type mutant lungs and Gm26878+/− mice lungs: P=0.443 and P=0.704, respectively).