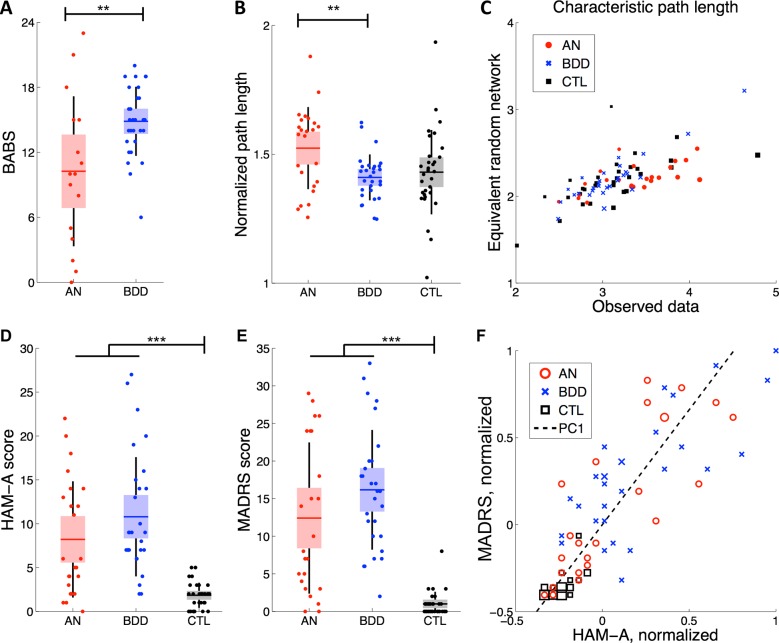
Fig 1. Dataset information.
(A) Participants with BDD had significantly different BABS scores than those with AN (p = 0.004). In this and all remaining panels, the horizontal line is the mean, box is the SEM 95% CI, black lines demarcate one standard deviation, and dots reflect individual participants. (B) NPL differed significantly between AN and BDD groups (p = 0.002). (C) The NPL comprised the observed CPL and the CPL of an equivalently-sized random network. This plot demonstrates that the denominator of NPL—the CPL of an equivalent random network—does not show large fluctuations that would explain the bimodal distribution in AN as presented in panel B. (D) Participants with AN/BDD scored significantly higher on the HAM-A scale than healthy controls (p< 0.001). (E) Participants with AN/BDD scored significantly higher on the MADRS scale than healthy controls (p< 0.001). (F) The first single principal component (PC1) of HAM-A and MADRS explained 93% of the variance among all participants with HAM-A and MADRS scores (n = 84). Larger markers represent the presence of more than one participant. BABS = Brown Assessment of Beliefs Scale; HAM-A = Hamilton Anxiety Rating Scale; MADRS = Montgomery-Asberg Depression Scale.

