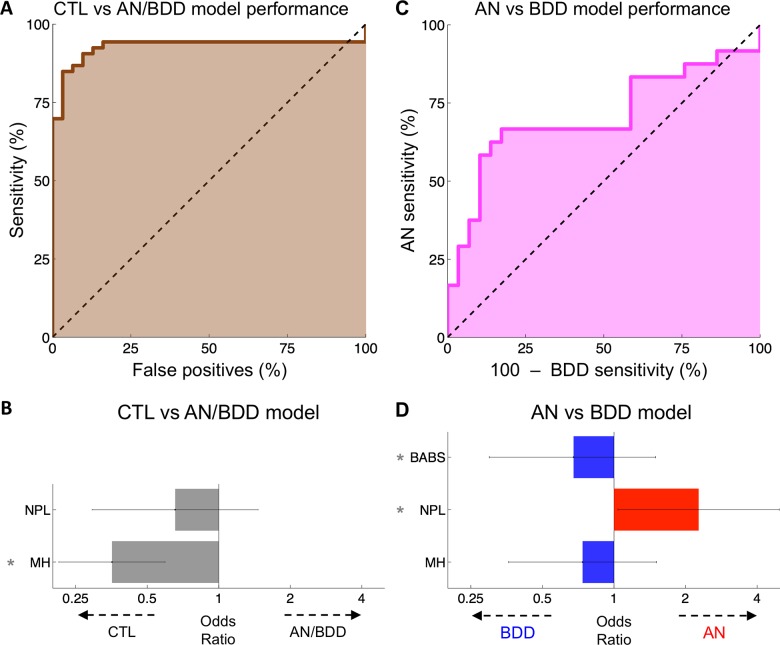
Fig 2. Classifier performance.
(A) The receiver operator characteristic of the healthy controls (denoted as CTL) vs AN/BDD model. Our model distinguished healthy controls from participants with AN or BDD with an AUC-ROC of 93%. (B) Bars reflect the weight of each factor used in the CTL vs AN/BDD classification, expressed as the odds ratio per standard deviation. Error bars are SEM and asterisks demarcate statistically significant features (). (C) Our AN vs BDD model distinguished participants with AN from those with BDD with an AUC-ROC of 67%. (D) The weight of each factor used in the AN vs BDD classification, expressed as an odds ratio per standard deviation. Error bars are (Gaussian) SEM and thus for reference only; significance values were calculated from the (non-Gaussian) permutations.

