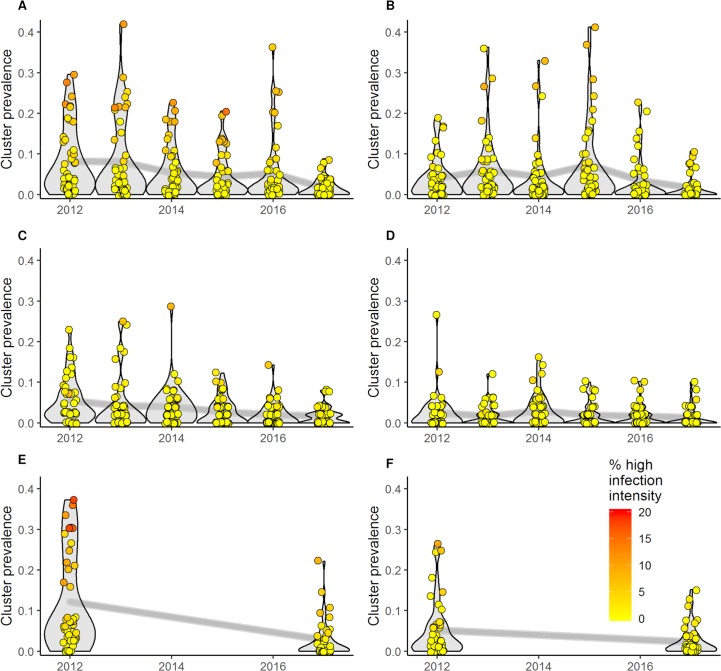
Fig 3. Change in S. haematobium prevalence and intensity.
Data are prevalence and intensity in 45 schools/shehias (clusters) per island, stratified by population group, island, and year. The color code shows the percentage of heavily infected individuals among those infected. A) 9- to 12-year old students in Pemba; B) 9- to 12-year old students in Unguja; C) 20- to 55-year old adults in Pemba; D) 20- to 55-year old adults in Unguja; E) 1st year students in Pemba; F) 1st year students in Unguja.

