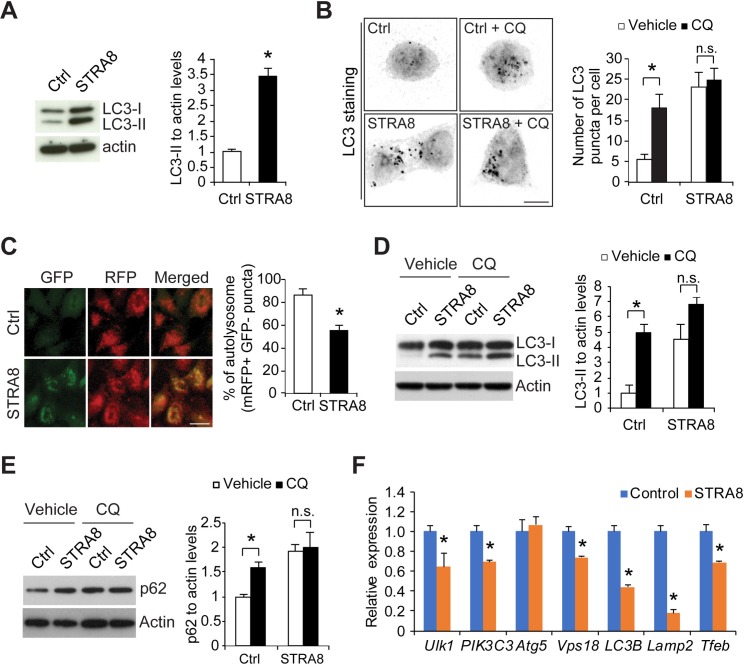
Fig 6. STRA8 inhibits autophagosome maturation under basal condition (no autophagy induction).
(A) Cell lysates from F9 cells that stably express GFP (Ctrl) or STRA8 (tagged with GFP) at normal conditions were subjected to Western blot analyses by using antibodies as indicated. Graphs show quantification of LC3-II to actin ratio. Data represent mean ± s.e.m.; n = 3 independent experiments; *P < 0.05 (Student’s t test). (B) Fluorescence microscope images of F9 cells expressing GFP (Ctrl) and STRA8 stained with antibodies against LC3 treated with or without chloroquine for 2 hours. Graph shows quantification of LC3-positive puncta per cell. Black dots represent LC3 puncta. The number of LC3-positive puncta in each cell was counted for 100 cells in each group. Data represent mean ± s.e.m.; n = 3 independent experiments; *P < 0.05 (Student’s t test). (C) Representative fluorescence images of HeLa cells stably expressing GFP-mRFP-LC3 transfected with empty (Ctrl) or STRA8-expressing plasmid. Transfection efficiency of the plasmid into HeLa cells was approximately 80–85%. Graph shows the percentage of autolysosome vesicles (GFP-negative RFP-positive) in total vesicles (mRFP-positive). 100 cells were analyzed in each group. Data represent mean ± s.e.m.; n = 3 independent experiments; *P < 0.05 (Student’s t test). (D, E) Cell lysates from F9 cells that stably express GFP (Ctrl) and STRA8 (tagged with GFP) treated with vehicle or chloroquine (CQ; 20 μM) for 2 hours were subjected to Western blot analyses using LC3 (D) or p62 (E) antibodies. Graph shows quantification of LC3-II (D) or p62 (E) to actin ratio. Data represent mean ± s.e.m.; n = 3 independent experiments; *P < 0.05 (Student’s t test). (F) qRT-PCR analysis of autophagy and lysosome genes in control F9 cells and F9 cells expressing stably STRA8. Data represent mean ± SD; n = 3 cultures per group. *P < 0.05 (Student’s t test).

