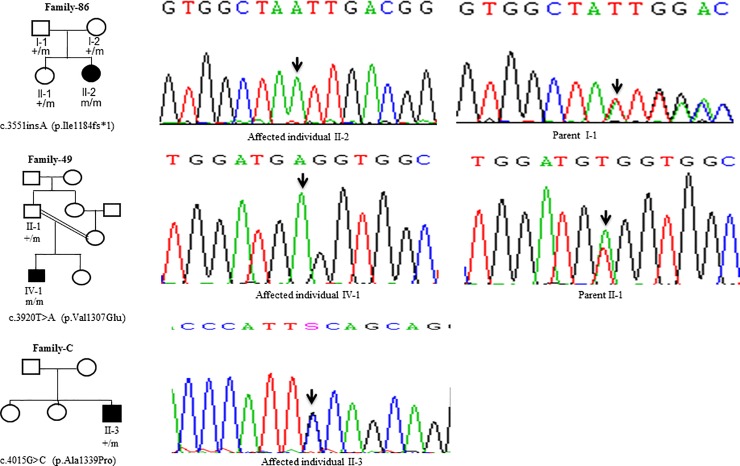
Fig 7. DNA sequence analysis of individuals from family-86, family-49 and family-C.
(Upper panel) Sequencing chromatograms from the affected individual II-2 and the parent I-1 from family-86. Arrows mark the insertion of the A residue in a homozygous state in the affected individual II-2 and in a heterozygous state in the parent I-1. (Middle panel) Sequencing chromatograms of the affected individual IV-1 and the parent II-1 from family-49. Arrows mark the T>A change in a homozygous state in the affected individual IV-1 and in a heterozygous state in the parent II-1. (Lower panel) Sequencing chromatogram from the affected individual II-3 from family-C. Arrow marks the G>C change in a heterozygous state in the affected individual II-3. + and m denote the wild type and mutant alleles, respectively.

