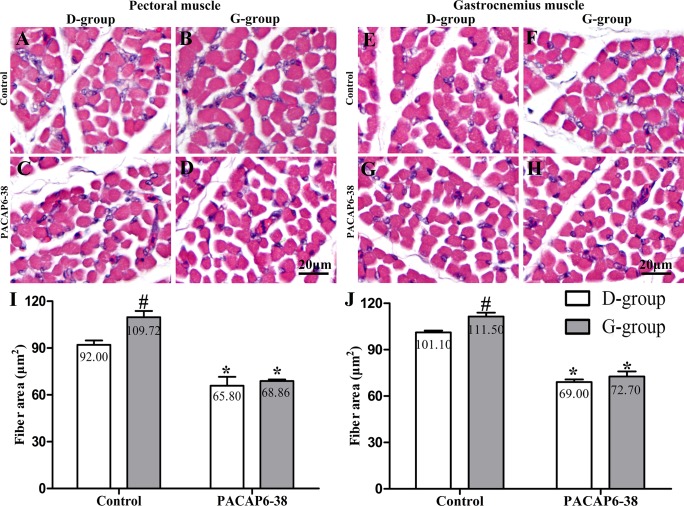
Fig 3. Effect of PACAP6-38 on myofiber areas of pectoral and gastrocnemius muscles in D-group and G-group.
Representative images of pectoral (A-D) and gastrocnemius (E-H) muscles in different treatments of D-group and G-group. (I) and (J) are quantitation of fiber area. A, C, E, G: D-group; B, D, F, H: G-group; A, B, E, F: Control treatments; C, D, G, H: PACAP6-38 treatments. Data are mean ± SEM. # p < 0.05 Vs. D-group control; * p < 0.05 Vs. different reagent treatment in the same light groups. Green light significantly increased cross-sectional area of myofiber compared with D-group. PACAP6-38 treatment had significantly decreased myofiber cross-sectional area. And no significant difference was observed between D-group and G-group. Scale bar = 20 μm.

