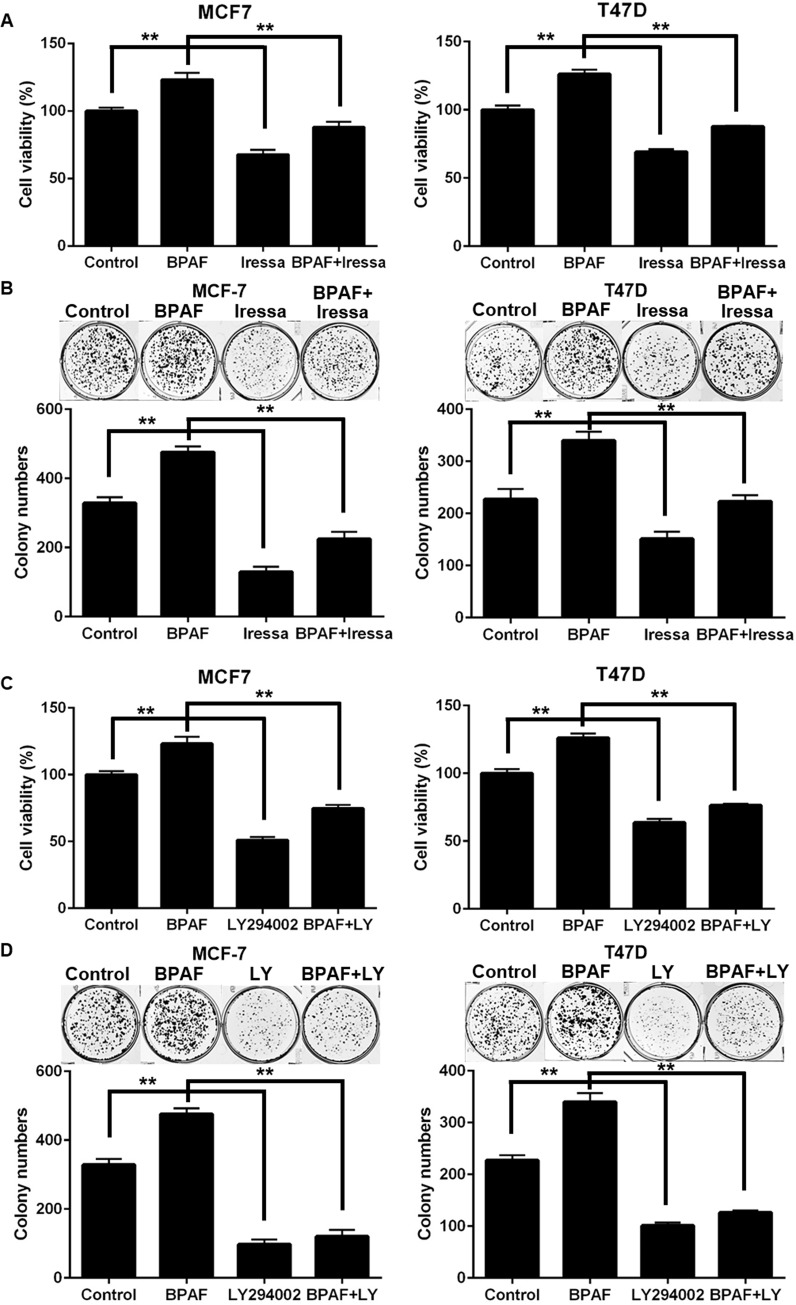
Fig 5. Inhibition of EGFR and PI3K blocks BPAF-induced cell growth.
A) MCF-7 and T47D cells were serum-starved for 48 hours in phenol red-free medium. Then, cells were treated with BPAF (1 μM) ± Iressa (2 μM) in phenol red-free medium with 5% C.S. FBS for 5 days. The average percentage of viable cells in each treatment group was determined with an MTT assay. B) MCF-7 and T47D cells were serum-starved for 48 hours in phenol red-free medium. Then, cells were treated with BPAF (1 μM) ± Iressa (2 μM) in phenol red-free medium with 5% C.S. FBS for 21 days, followed by fixation and staining with crystal violet. The graphs in the lower panels present the average number of colonies formed with representative images in the panels above. C) MCF-7 and T47D cells were serum-starved for 48 hours in phenol red-free medium. Then, cells were treated with BPAF (1 μM) ± LY294002 (5 μM) in phenol red-free medium with 5% C.S. FBS for 5 days. The average percentage of viable cells in each treatment group was determined with an MTT assay. D) MCF-7 and T47D cells were serum-starved for 48 hours in phenol red-free medium. Then, cells were treated with BPAF (1 μM) ± LY294002 (5 μM) in phenol red-free medium with 5% C.S. FBS for 21 days, followed by fixation and staining with crystal violet. The graphs in the lower panels present the average number of colonies formed with representative images in the panels above. All values are presented as the means ± S.E. (**P<0.01).

