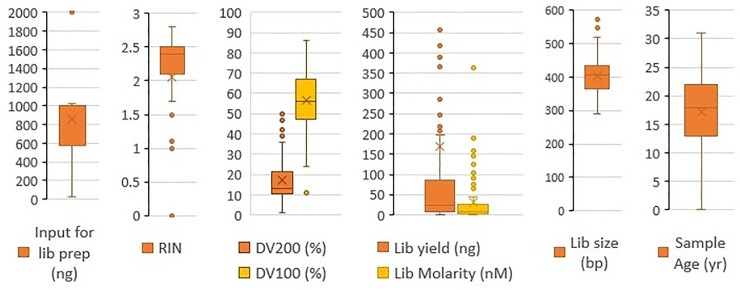
Fig 1. Sample and library QC box plots.
The plots the median, mean and standard deviation of sample storage age, RIN, fragment distribution values (DV) (DV200 and DV100), input amount for library, library yield, library molarity, and library size distributions. For each box and whisker plot, the middle line of the box represents the median, and the ‘x’ represents the mean.The top and bottom lines represent 75th and 25th percentile, respectively. The whiskers extend to the data point 1.5 times the interquartile range above the 3rd quartile or below the first quartile. Values outside this range are represented by dots. Extreme outliers in the plots for input for library preparation (4731 ng and 2000 ng) and library yield (5467.95 ng and 985.95 ng) have been omitted for clarity of visualization of the distributions. Values that could not be obtained are designated as N/A in Table 2 and were not included in Fig 1.

