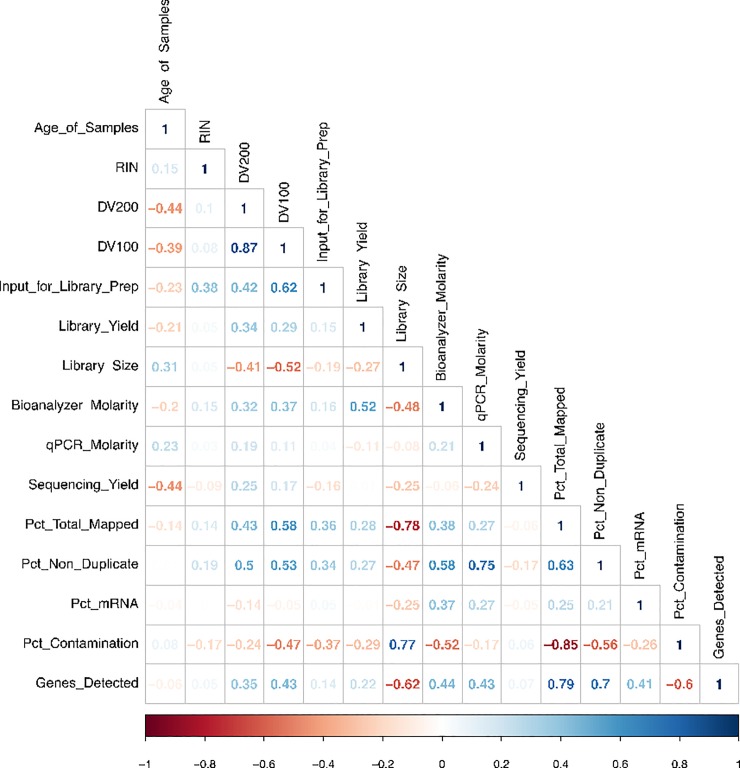
Fig 2. Correlations analysis based on QC results.
Correlations analysis based on QC results and sample metadata. Pearson correlation coefficients were calculated for a matrix of the various parameters examined in this study; the correlation matrix using the R package corrplot. The parameters included in the matrix were: age of samples in years (Age of Samples), RIN, DV200, DV100, library input of starting material (Input_for_Library_Prep), Bioanalyzer measurement of library yield in ng (Library_Yield), library size in base pairs (Library Size), molarity of the libraries in nM (Bioanalyzer Molarity), qPCR molarity, sequencing yield, total percentage of mapped reads to human (Pct_Total_Mapped), total percentage of non-duplicate mapped reads (Pct_Non_Duplicate), percent mRNA bases mapped to human (Pct_mRNA), total percentage of mapped reads to bacterial and mouse genomes (Pct_Contamination), and total number of genes which have more than 5 read mapped (Genes_Detected). Positive correlations are displayed in blue and negative correlations in red color. Color intensity is proportional to the correlation coefficients. In the bottom of the correlogram, the legend color shows the correlation coefficients and the corresponding colors. Values between 0.7 and 1.0 (-0.7 and -1.0) indicate a strong positive (negative) linear relationship. Samples with NA values were excluded.

