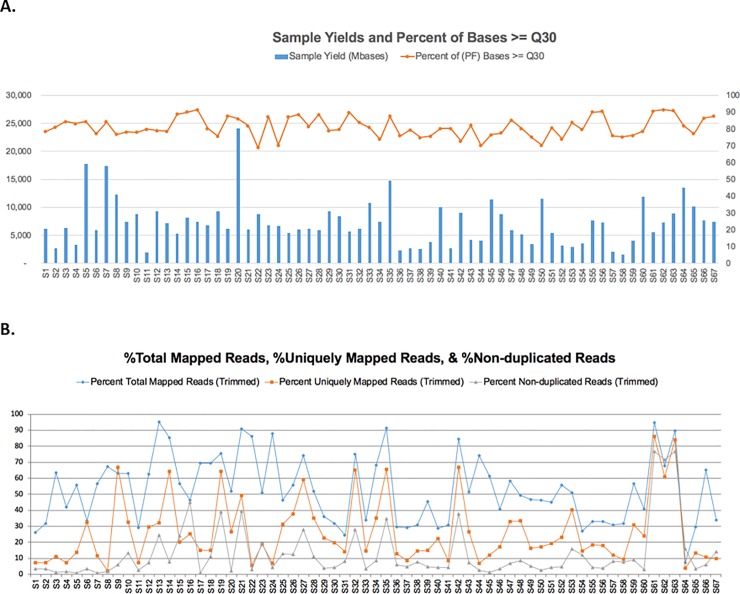
Fig 4. Sequencing QC Statistics.
a) Sample sequencing yield and base call quality statistics. The bar chart shows the raw sequencing yields in million bases for each sample. There are large variations of the sequencing yield among the 67 samples in the study. The top line chart shows the percentages Q30 bases of all sequencing reads in each sample. b) Sample sequencing reads total mapped (% of reads that are mapped to reference genome), uniquely mapped (% of reads that are uniquely mapped to the reference genome) and non-duplicated reads (% of non-duplicated reads which are not PCR redundancy).

