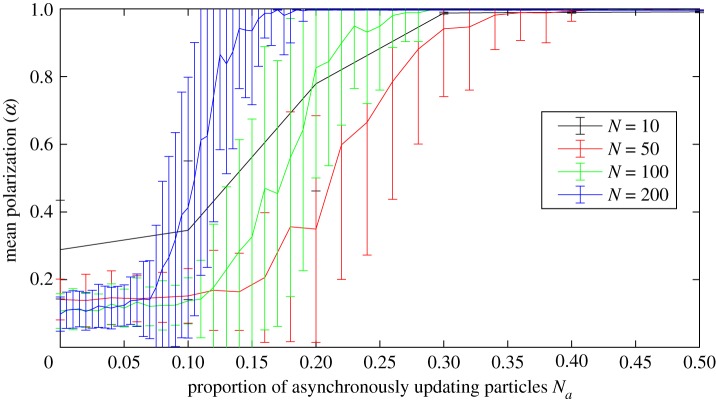
Figure 7.
Mean polarization of groups of size N = 10, 50, 100 and 200 as a function of the proportion of asynchronously updating particles Na. The curves represent the mean and the bars the standard deviations over 100 simulations for each value of Na. We see that, except for the N = 10 case, the proportion required for consistent complete polarization decreases with group size; larger than 0.4 for N = 50, 0.3 for N = 100 and 0.2 for N = 200.

