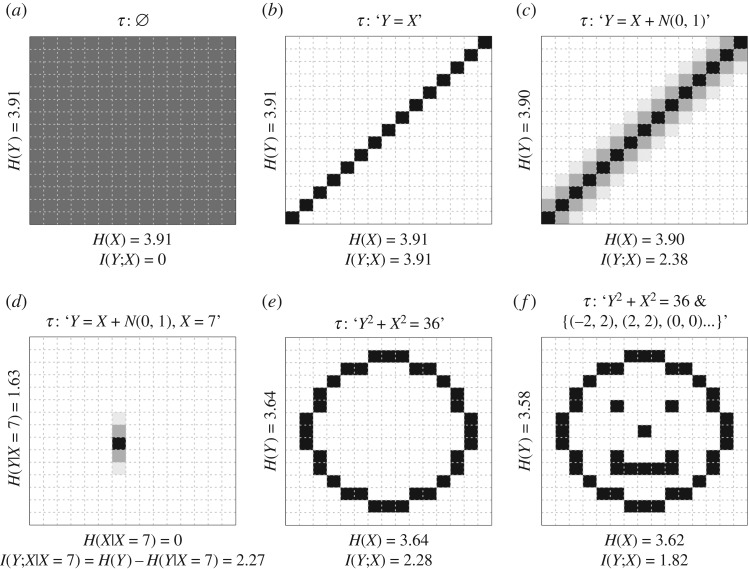
Figure 1.
Pictorial representation of various patterns, with corresponding values of entropy and mutual information. The descriptions of the patterns τ are purely illustrative and not necessarily literal descriptions of what the pattern encodings would look like in practice. The intensity of grey in each cell represents the relative probability of occurrence of different cell values, with black= 1 and white= 0. The entropy and mutual information values were calculated by normalizing the cell values in the table or at the margins. For further details, see the source code in electronic supplementary material.

