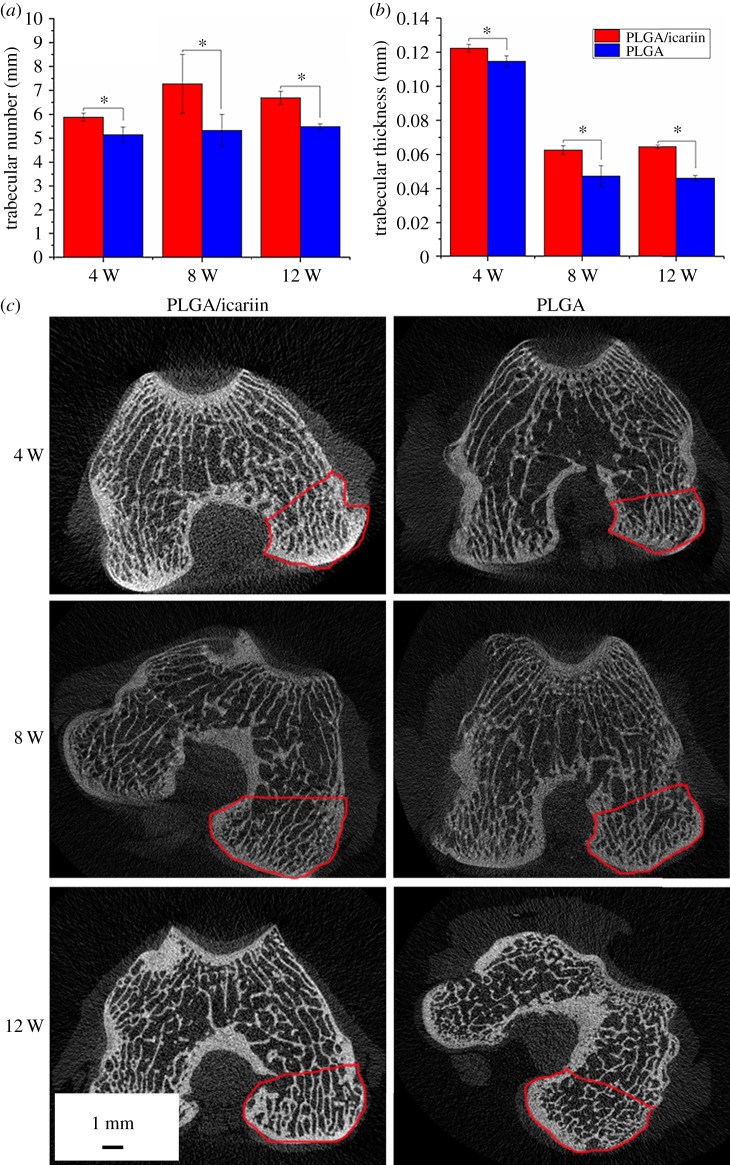
Figure 11.
X-ray microtomography examination. (a) Trabecular number. (b) Trabecular thickness. *p < 0.05. Both the PLGA group and the PLGA/icariin group exhibited a decrease in Tb.Th and Tb.N, and the decline in levels of the PLGA/icariin group was slower. (c) CT scans of the distal femur; there were more hyperplastic bones around the joints in the PLGA group. The area in the red line is the region of interest for the X-ray microtomography test.

