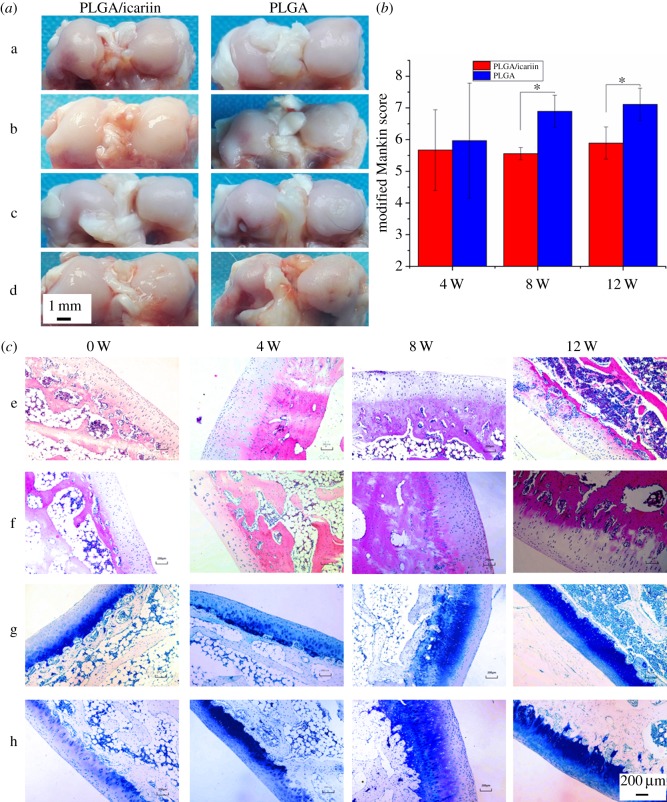
Figure 9.
Histological observation and evaluation. (a) Distal femur morphology (a: the morphology of distal femur pre-implantation; b: the morphology of distal femur four weeks after implantation; c: the morphology of distal femur eight weeks after implantation; d: the morphology of distal femur 12 weeks after implantation). (b) The modified Mankin scores; the modified Mankin score in the PLGA group was significantly higher than that of the PLGA/icariin group at eight weeks and 12 weeks post-surgery (p < 0.05), *p < 0.05. (c) The chondrocytes were arranged in a straight line in the PLGA/icariin group, while the chondrocytes in the PLGA group were clustered, and the proteoglycan stained with toluidine blue was gradually reduced in both groups (e: HE stain of PLGA group; f: HE stain of PLGA/icariin group; g: toluidine blue stain of PLGA group; h: toluidine blue stain of PLGA/icariin group). Bar lengths are 200 µm.

