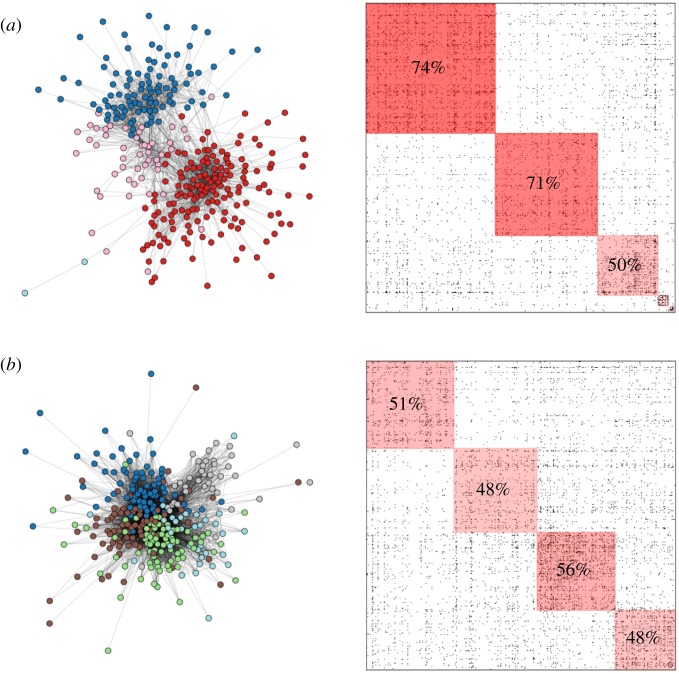
Figure 3.
Sampled social networks and adjacency matrices of high (a) and low (b) fragmentation settlements. Node colours indicate membership in communities. In the adjacency matrices, percentages indicate the share edges staying within each community. In the fragmented settlement, communities have significantly fewer connections with other communities.

