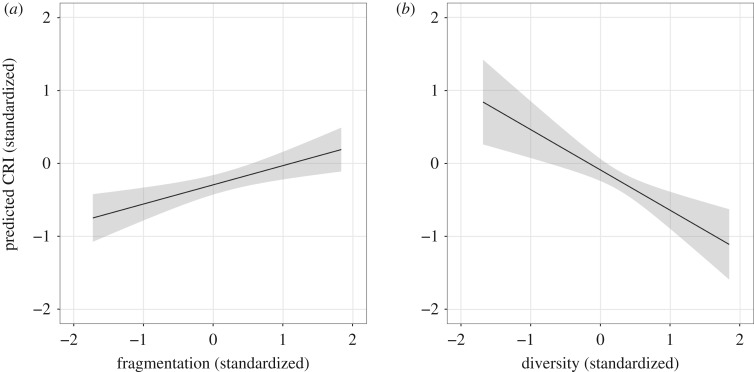
Figure 5.
Plots of marginal effects of the key social capital variables and their predicted impact on a settlement’s rate of closed procedure or single bidder contract awards; shaded regions represent 90% confidence intervals. As the variables are standardized, unit changes on either axis can be interpreted as standard deviation changes. Fragmentation (a), quantifying excess bonding social capital in a community, predicts higher corruption risk, while diversity (b) predicts lower corruption risk.

