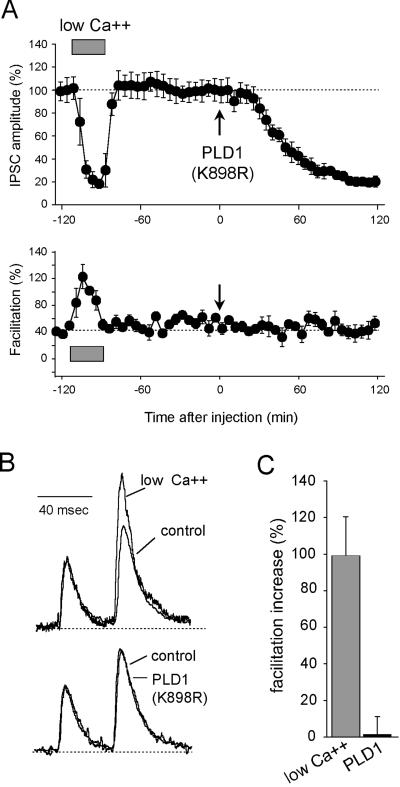
Figure 3.
PPF in PLD1(K898R)-injected neurons. Paired stimuli (40-msec interpulse interval) were applied in control and low extracellular [Ca2+/Mg2+] (0.42 and 0.14, respectively) and after injection of PLD1(K898R). (A) Amplitude of the first IPSCs averaged for periods of 10 min during the course of the experiment. The mean PPFs measured during the same periods of time are presented (Lower). External [Ca2+/Mg2+] = 0.14 (hatched bar). Pressure injection of PLD1(K898R) (Arrow). (B) Traces recorded at time −90 min (low [Ca2+/Mg2+]), −10 min (control), and +100 min [PLD1(K898R)]. For comparison, responses were scaled at the first IPSC in the pair. (C) At the same level of ACh release (see A), PPF was averaged and represented as the percentage increase in PPF relative to the control situation.

