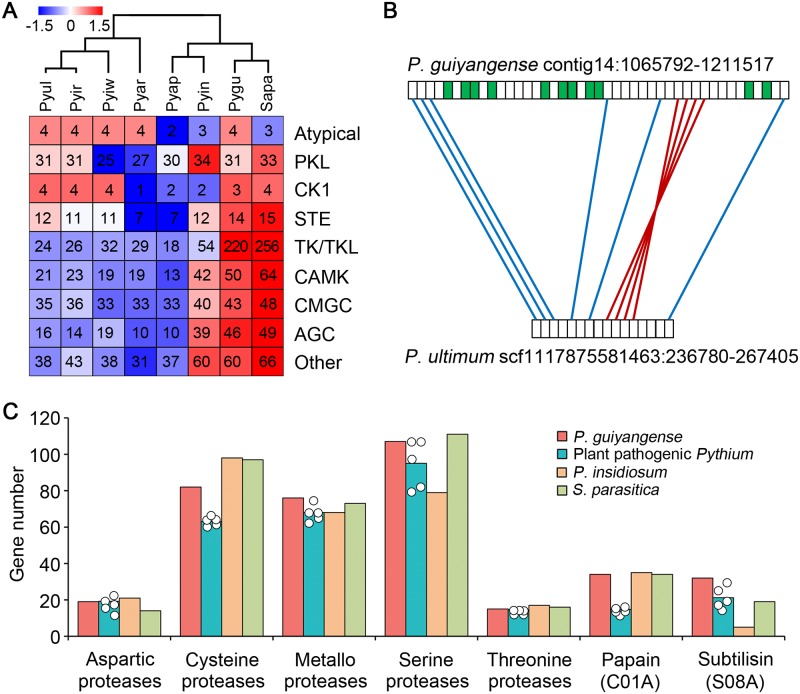
Fig 4. Expansion of kinases and proteases in P. guiyangense.
(A) Comparison of kinase gene numbers between P. guiyangense and other oomycetes. The numbers of family members per haploid genome are shown in each case, including P. guiyangense. Overrepresented (white to red) and underrepresented (white to blue) numbers are depicted as Z-scores for each family. Pygu, P. guiyangense; Pyin, P. insidiosum; Pyap, P. aphanidermatum; Pyar, P. arrhenomanes; Pyir, P. irregulare; Pyiw, P. iwayamai; Pyul, P. ultimum; Sapa, S. parasitica. (B) Synteny of TKL kinase genes between P. guiyangense and P. ultimum. The region shown is an example of dense clustering of TKL kinase genes in the P. guiyangense genome assembly. The green boxes represent TKL kinase genes. Red lines join syntenic genes with the same orientation and the blue lines join genes with reversed orientations. (C) Comparison of protease gene numbers between P. guiyangense and other oomycetes. The teal columns represent the average number of genes per haploid genome of the five plant pathogenic Pythium species, while each dot represents the number in an individual plant pathogenic Pythium species. For P. guiyangense, the unique gene number in each haploid genome was used.

