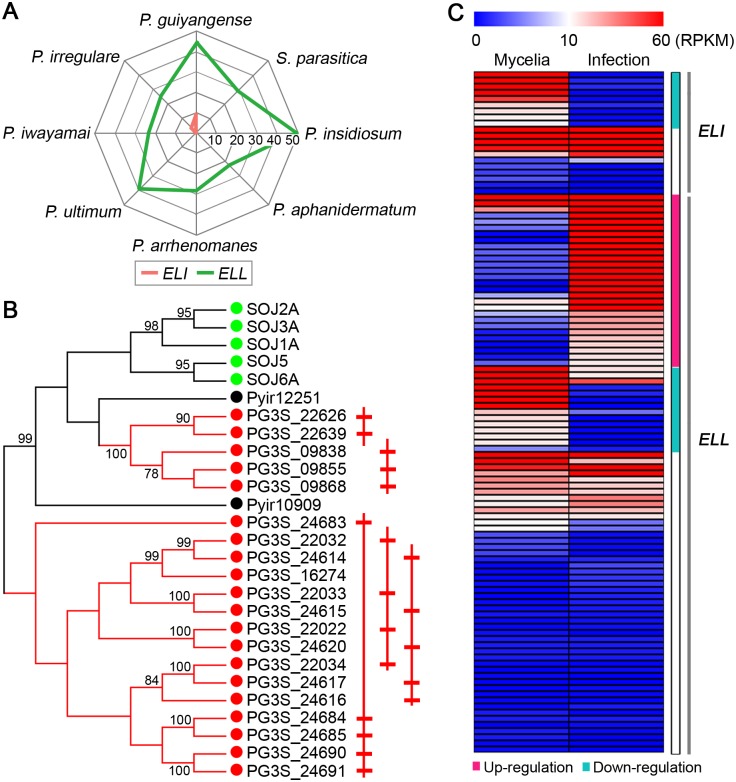
Fig 5. Expansion of ELI and ELL genes.
(A) Radar charts showing the numbers of elicitin (ELI) and elicitin-like (ELL) genes found in each Pythium or S. parasitica genome. For P. guiyangense, the unique gene number in each haploid genome was used. Each spoke in the chart represents one species. The concentric circles form a ruler with a primary unit of 10 genes. (B) Phylogenetic tree of the ELI genes, showing species-specific expansion of P. guiyangense ELI genes. Members from P. guiyangense (PG3S, red), P. irregulare (Pyir, black), and Ph. sojae (SOJ, green) are included. On the right the physically linked ELI genes are schematically drawn. (C) Relative transcript abundance of ELI and ELL genes at 24 hpi infection versus mycelia tissue. The teal bar highlights the significantly down-regulated genes, and the pink bar highlights the significantly up-regulated genes.

