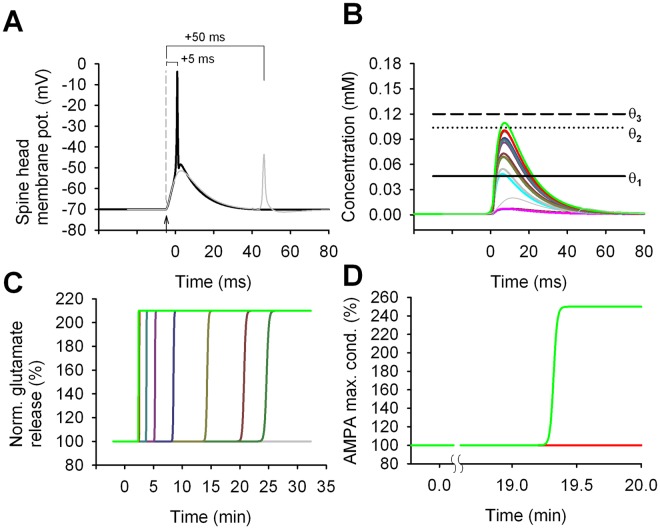
Fig 3. Signals triggered by the 70x 1:1 t-LTP protocol.
A) Membrane potential in a spine during a single induction stimulus (black trace); an EPSP was triggered (arrowhead) Δt = 5 ms before the arrival of a bAP (t = 0 was the time of the bAP peak); the grey trace shows the result for Δt = 50 ms. B) The [Ca2+]i transient generated in the individual spines by a single conditioning stimulus; the thin grey trace shows the transient in one of the spines for Δt = 50 ms. C) and D) show the time course for the normalized glutamate release and the peak AMPA conductance, respectively, in individual synapses, after the train of 70 conditioning stimuli. Note that the induction protocol triggered pre-synaptic potentiation in almost all synapses; post-synaptic potentiation was induced in the only synapse (green trace) in which the [Ca2+]i crossed the threshold θ2 during each conditioning stimulus. Note that the vertical axes of panels C and D do not have the same scales.

