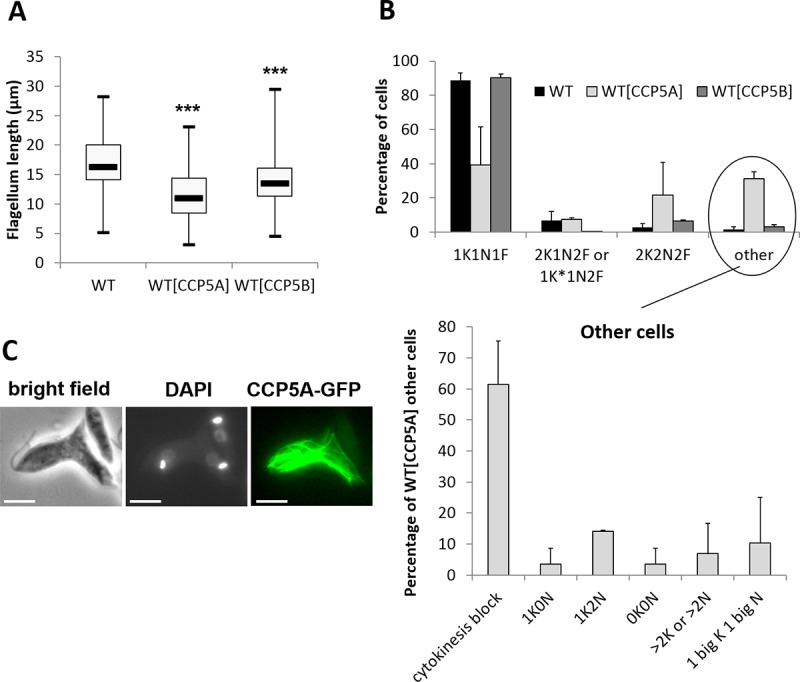
Fig 4. Overexpression of CCP5A and CCP5B induced flagellum length decrease and cell cycle defects.

(A) Box plots representing flagellum length of WT, CCP5A overexpressing and CCP5B overexpressing cells. Minimum 40 cells were analyzed. The thick line inside each box represents the median value; the lower and upper edge of each box indicate the 25th and 75th percentiles, respectively; the lower and upper whiskers (ends of the box arms) represent the minimum and maximum, respectively. t-test: *: p<0.05, **: p<0.01, ***: p<0.001 (B) Cell cycle configuration of WT cells and cells overexpressing CCP5A or CCP5B. The lower panel corresponds to the configuration of the abnormal (other) cells. When CCP5A was overexpressed, we noted the appearance of abnormal cells, consisting essentially of cells blocked in cytokinesis (about 20% of the total population). The overexpression of CCP5B induced no obvious cell cycle defect (K = Kinetoplast; K* = Kinetoplast in replication or in G2 phase prior to segregation; N = Nucleus; F = Flagellum). (C) Fluorescence microscopy showing the localization of CCP5A as filament-like structures in a cell blocked in cytokinesis (bar = 5μm).
