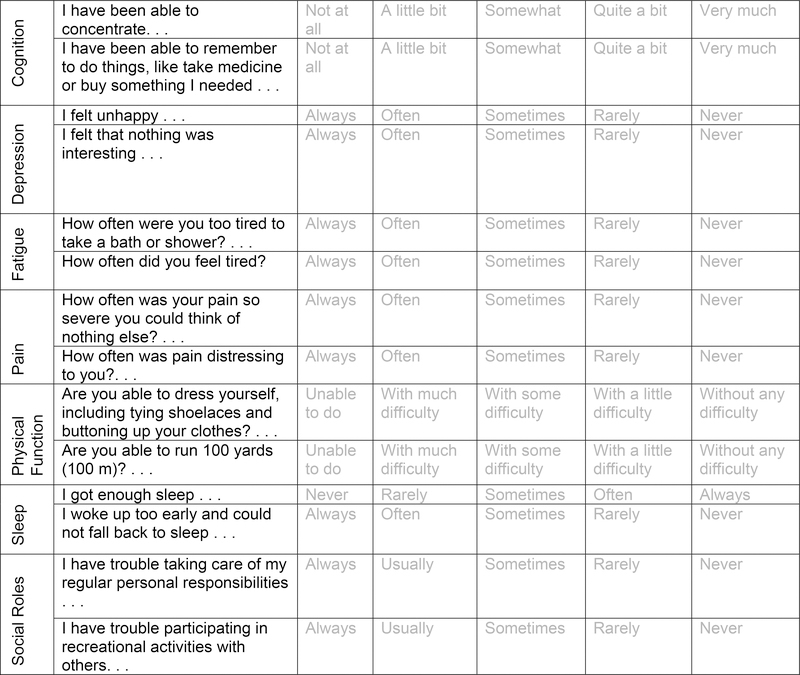
Figure 2.
Health-state descriptions in the PROPr survey. Health-state descriptions were given as a table like the one above, with one answer selected for each item (row). For example, the health state describing the highest functional capacity on each domain (called full health) would have the rightmost column selected for all items. The health state describing the lowest functional capacity on each domain (called the all-worst state) would have the leftmost column selected for all items.

