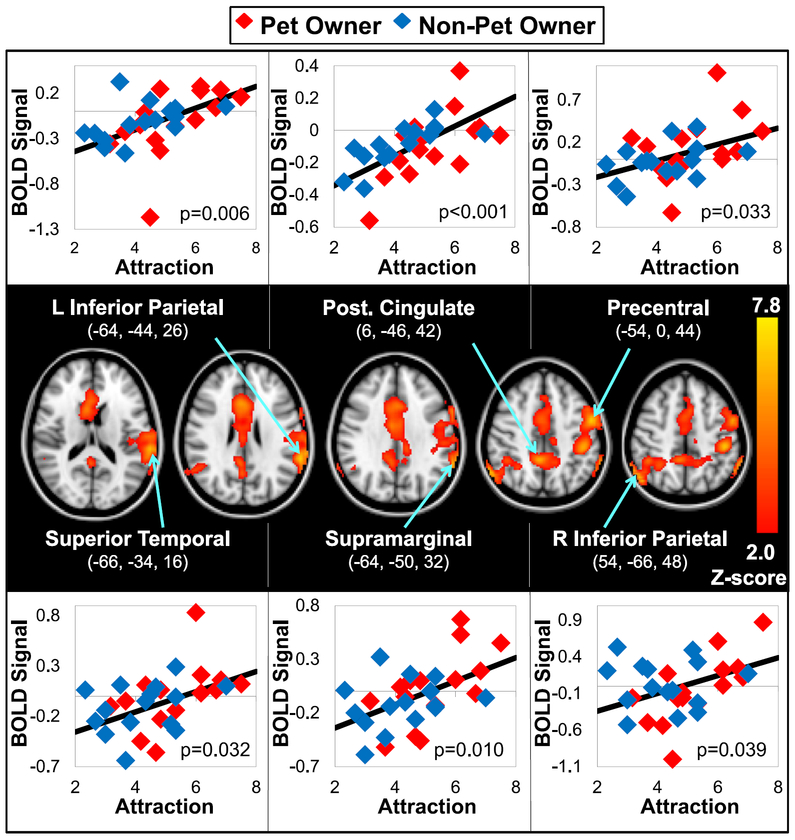
Fig. 3.
Stronger Attraction rating, regardless of Pet Ownership status, predicted stronger BOLD Response during the viewing of Paradigm A animal photographs. Z (Gaussianised T/F) statistic images were thresholded using clusters determined by Z > 1.96 and a cluster significance threshold of p-(corrected) < 0.05. Mean Attraction ratings are averaged Likert ratings of “general attraction” to six companion animal species groups (1=no attraction; 10=strong attraction). Scatterplots above and below these Z-maps at specific brain regions show the corresponding subject-level data; BOLD responses are shown as contrast of parameter estimate (COPE) values. Results of the post-hoc regressions are indicated next to the plots (no group or interaction effects were found). See Table 3 for details regarding cluster size and significance.

